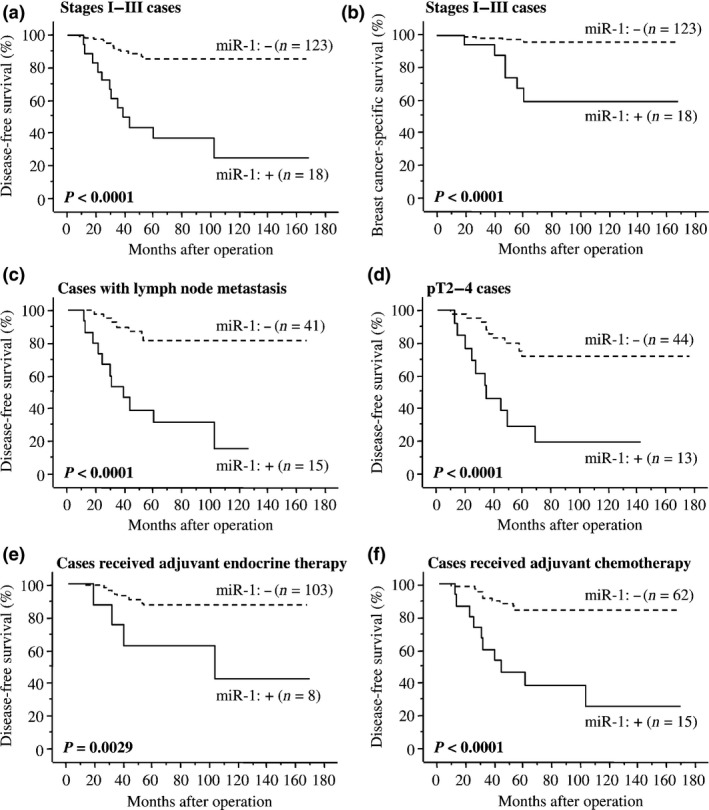
Figure 4.

Disease‐free (a,c–f) and breast cancer‐specific survival (b) of stages I–III breast cancer patients according to miR‐1 ISH status using the Kaplan–Meier method. The solid line shows miR‐1‐positive cases and the dashed line shows miR‐1‐negative cases. Statistical analysis was performed using the log‐rank test. P‐values < 0.05 were considered significant and are shown in bold.
