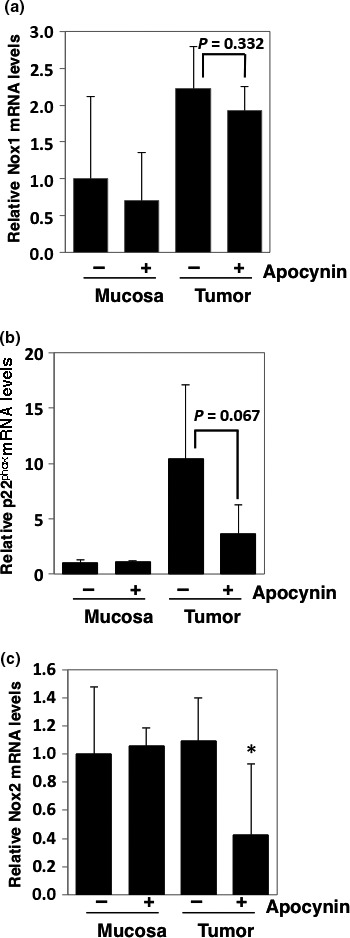
Figure 2.

Relative expression levels of NADPH oxidase‐associated genes in intestinal mucosae and tumors of Min mice. Real‐time PCR analysis was used to obtain Nox1 (a), p22phox (b), and Nox2 (c) mRNA expression levels. Values were set at 1.0 in untreated controls, and relative levels were expressed as mean ± SD (n = 4, a pair of mucosa and tumor samples for apocynin or untreated controls). *P < 0.05 versus untreated control. GAPDH mRNA levels were used to normalize data.
