
Fig. 7.
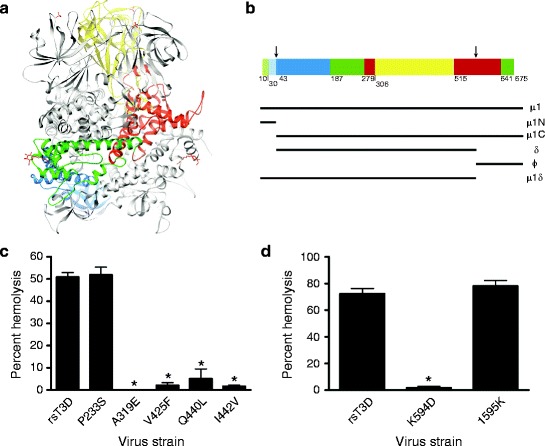
The μ1 protein mediates membrane penetration. (a) Ribbon diagram of the crystal structure of the T1L μ1 trimer without bound σ3. One μ1 subunit is colored by domain (domain I, light and dark blue [μ1N, μ1C]; domain II, light and dark green [μ1N, μ1C]; domain III, red; domain IV, yellow); the other two μ1 subunits are shown in gray. The β-octyl glucosides and sulfate ions present in the structure are shown in red and yellow. (b) Domain segmentation of the amino acid sequence as determined from the three-dimensional structure. The domain color code is as depicted in (a). Cleavage sites are indicated by arrows. Figure modified from Liemann et al. (2002). (c and d) A 3% v/v solution of bovine erythrocytes was incubated with 5.4 × 10¹⁰ ISVPs of wild-type rsT3D or the indicated μ1 δ (c) or μ1 φ (d) mutant at 37°C for 1 h. Hemolysis was quantified by determining absorbance of the supernatant at 415 nm. Hemolysis following treatment of an equal number of cells with virion-storage buffer or virion-storage buffer containing 1% TX-100 was considered to be 0 or 100%, respectively. Results are expressed as mean percent hemolysis for triplicate samples. Error bars indicate SD. *, P < 0.05 as determined by Student’s t-test in comparison to rsT3D. Figure modified from Danthi et al. (2008a, b)