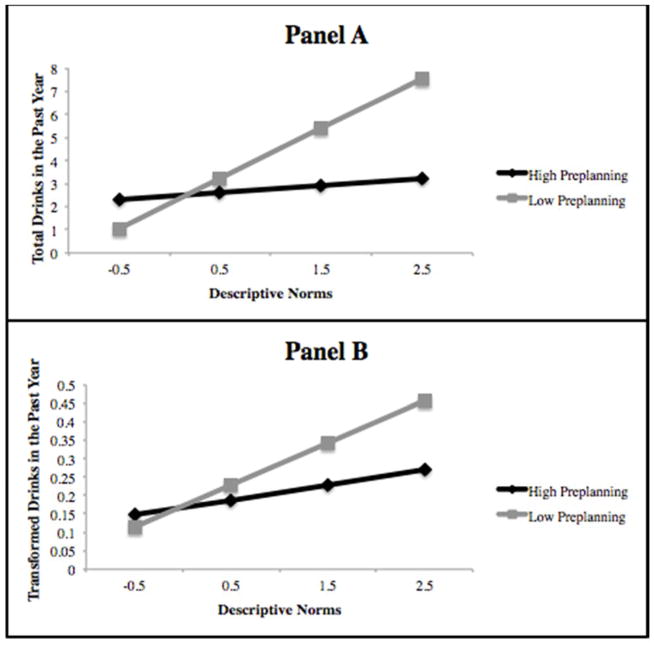
Figure 1.
Simple slopes for descriptive norms at high and low cognitive preplanning
Note. Panel A depicts simple slopes for the non-transformed drinks in the past year and Panel B depicts simple slopes for the reciprocally transformed drinks in the past year variable. The value of −0.5 corresponds to none and the value of 2.5 corresponds with the midpoint of most and all on the descriptive norms scale.

