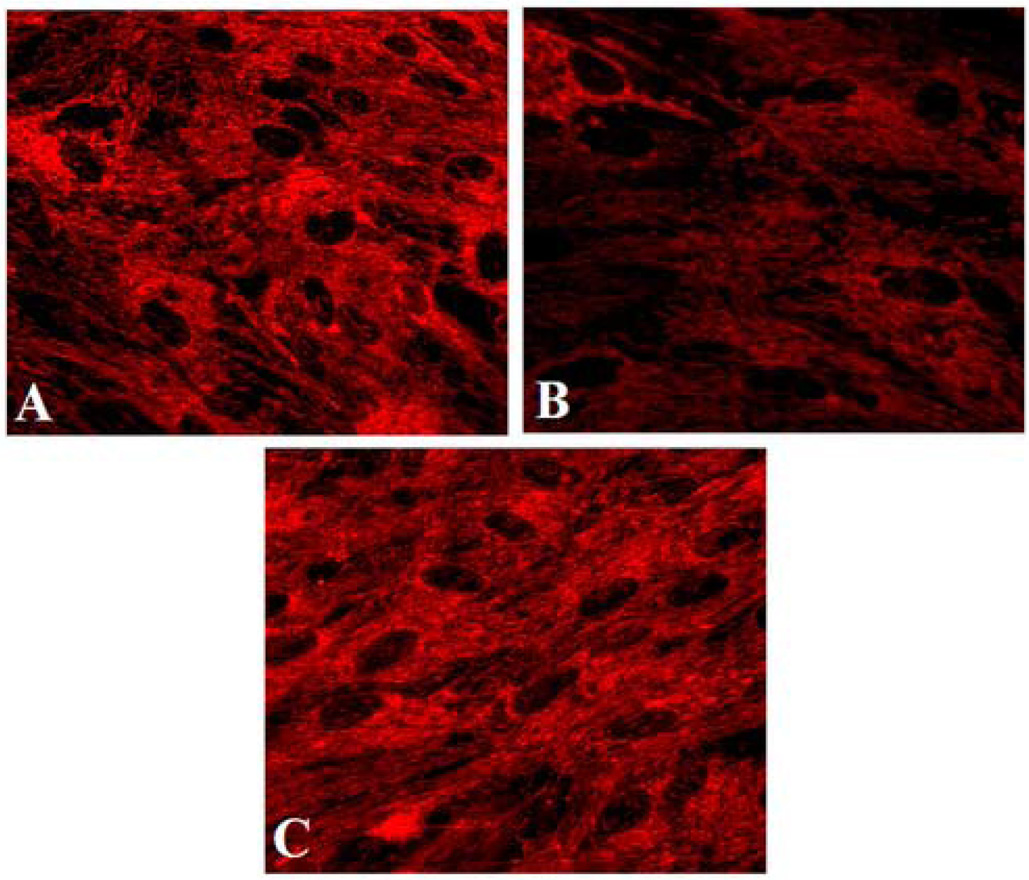
Figure 2.
Fluorescence images of cultured astrocytes treated with ammonia for 24 h. Astrocytes were loaded with TMRE (25 nM; 15 min) and images were captured and examined with a fluorescence microscope. A. Control astrocytes show prominent fluorescence. B. Astrocytes treated with ammonia show decreased fluorescence, consistent with depolarization of the mitochondrial membrane potential. C. Astrocytes treated with CsA (1 µM) show fluorescence similar to that of the control.

