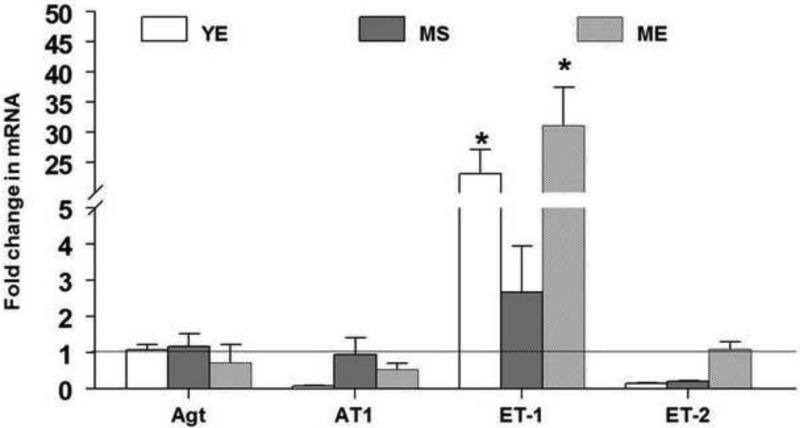
Fig 4.
The fold change in the gene expression of angiotensinogen (Agt), angiotensin II receptor, type 1b (AT1), endothelin-1 (ET-1), endothelin-2 (ET-2) in the RVLM after 90 days of E2 exposure are shown above. The fold change for each mRNA was calculated by the comparative CT method using 2−ΔΔCt. The Ct values of all the genes were normalized to β-actin and the Ct values from different groups were expressed relative to that in young intact sham rats. * denotes significant difference (p<0.05) from control (YS) group.

