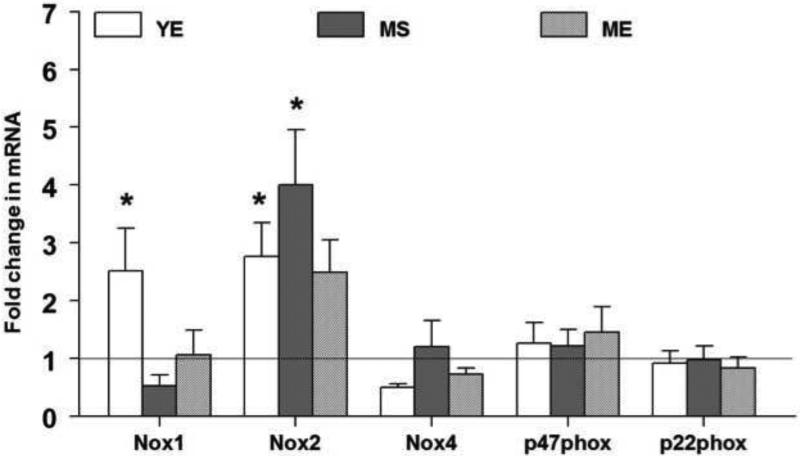
Fig 5.
The mRNA expression levels of NADPH oxidase subunits in the RVLM in response to 90 days of E2 exposure are shown above. The fold change for each mRNA was calculated by the comparative CT method using 2−ΔΔCt. The Ct values of all the genes were normalized to β-actin and the Ct values from different groups were expressed relative to that in young intact sham rats. * denotes significant difference (p<0.05) from control (YS) group.

