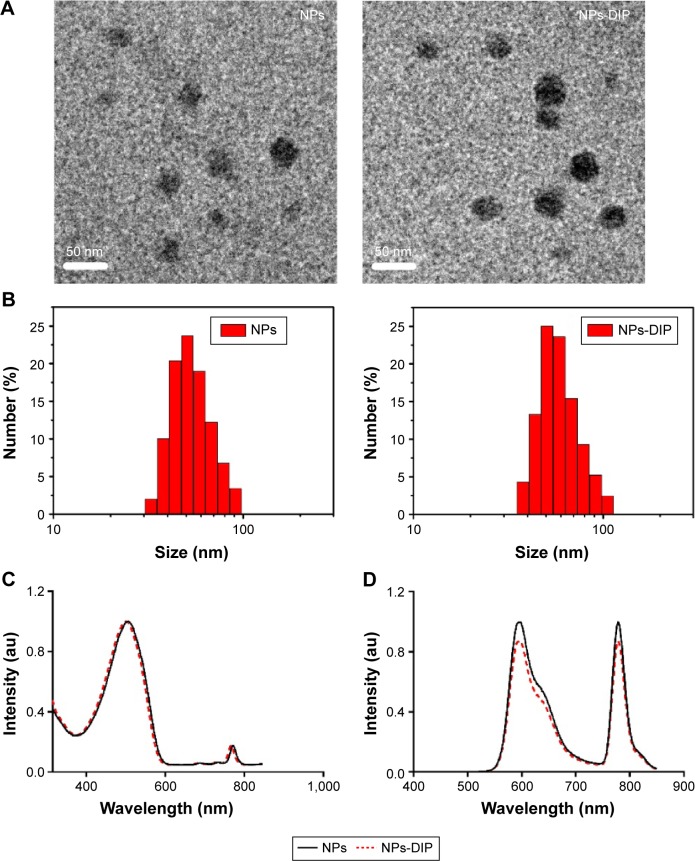
Figure 3.
Characterization of nanoparticles.
Notes: (A) Representative TEM images of nanoparticles. Scale bar: 50 nm. (B) DLS measurements of size distribution of two indicated nanoparticles in water. (C) Ultraviolet–visible absorption spectra of NPs-DIP and NPs. (D) Fluorescence emission spectra of NPs-DIP and NPs, the excitation wavelength is 494 nm.
Abbreviations: TEM, transmission electron microscope; DLS, dynamic light scattering; NPs, nanoparticles; NPs-DIP, Ser–Glu-functionalized NPs.

