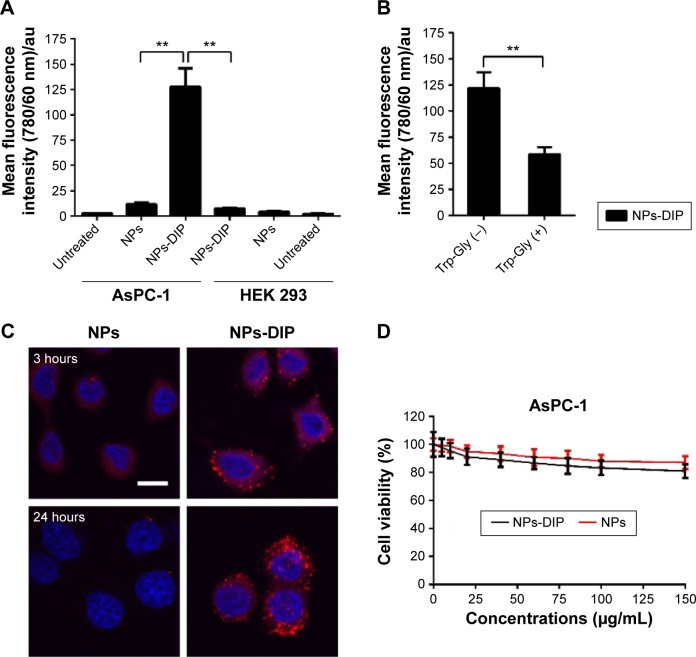
Figure 4.
In vitro analysis of pancreatic cancer cells AsPC-1 incubated with nanoparticles.
Notes: (A) Cell binding assay of indicated nanoparticles (6 µg/mL) on pancreatic cancer cells AsPC-1 and HEK 293 cells at 12 hours evaluated by flow cytometry (FACS). Error bars represent SD (n=3). **P<0.01 (two-tailed Student’s t-test); (B) The effect of PEPT1 activity inhibition on NPs-DIP targeting to AsPC-1 cells analyzed by FACS. AsPC-1 cells were treated with NPs-DIP (6 µg/mL) in the presence and absence of Trp-Gly (20 mM), an inhibitor of PEPT1, for 12 hours. Error bars indicate SD (n=3). **P<0.01 (two-tailed Student’s t-test); (C) Subcellular localization of nanoparticles (6 µg/mL) in AsPC-1 cells at different time points observed by confocal microscopy. Scale bar: 10 µm; (D) MTT analysis of AsPC-1 cells incubated with various concentrations of nanoparticles for 24 hours. Error bars represent SD (n=6).
Abbreviations: au, arbitrary unit; NPs, nanoparticles; NPs-DIP, Ser–Glu-functionalized NPs; SD, standard deviation.

