Figure 5.
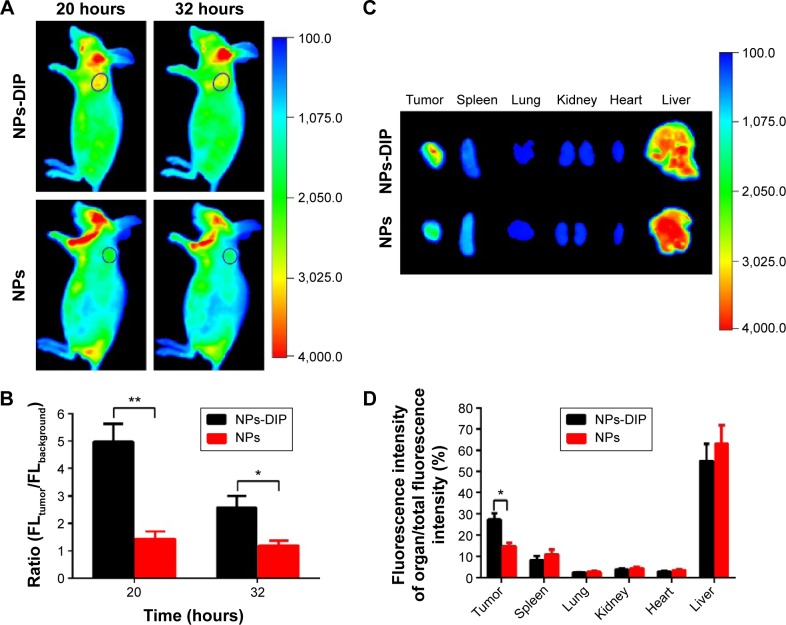
In vivo fluorescence imaging of NPs-DIP in pancreatic tumor xenograft model.
Notes: (A) Time-dependent target imaging of AsPC-1 tumor-bearing mice (tumor diameter ~0.3 cm, indicated by a blue circle) after intravenous injection with nanoparticles (each at 60 µg), using In-Vivo Multispectral System FX (Kodak, Rochester, NY, USA) with 490 nm excitation and 790 nm emission filters; (B) Region of interest (ROI) analysis of fluorescence intensity for tumor over background of mice in (A). Error bars indicate SD (n=3). **P<0.01, *P<0.05 (two-tailed Student’s t-test); (C) Representative ex vivo image of excised main organs and tumors at 32 hours post-injection with nanoparticles, using In-Vivo Multispectral System FX (Kodak) with 490 nm excitation and 790 nm emission filters; (D) Quantitative analysis of the percentage of organ NIR fluorescence intensity in (C). Error bars show SD *P<0.05 (two-tailed Student’s t-test).
Abbreviations: NPs, nanoparticles; NPs-DIP, Ser–Glu-functionalized NPs; SD, standard deviation.

