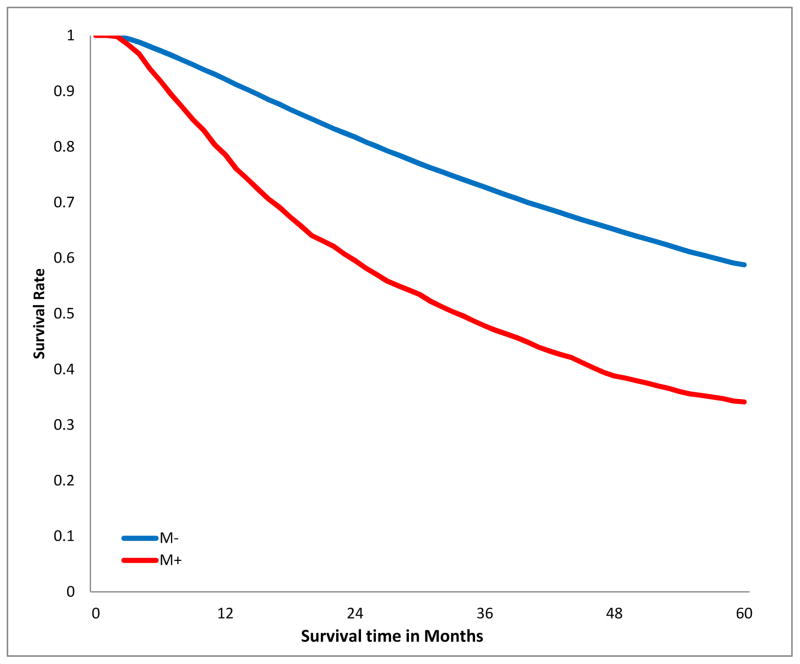
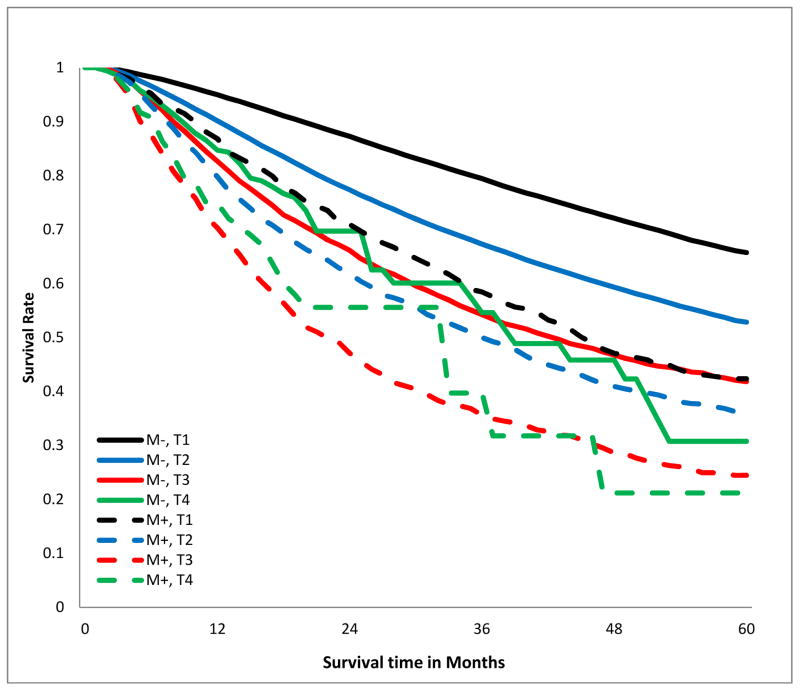
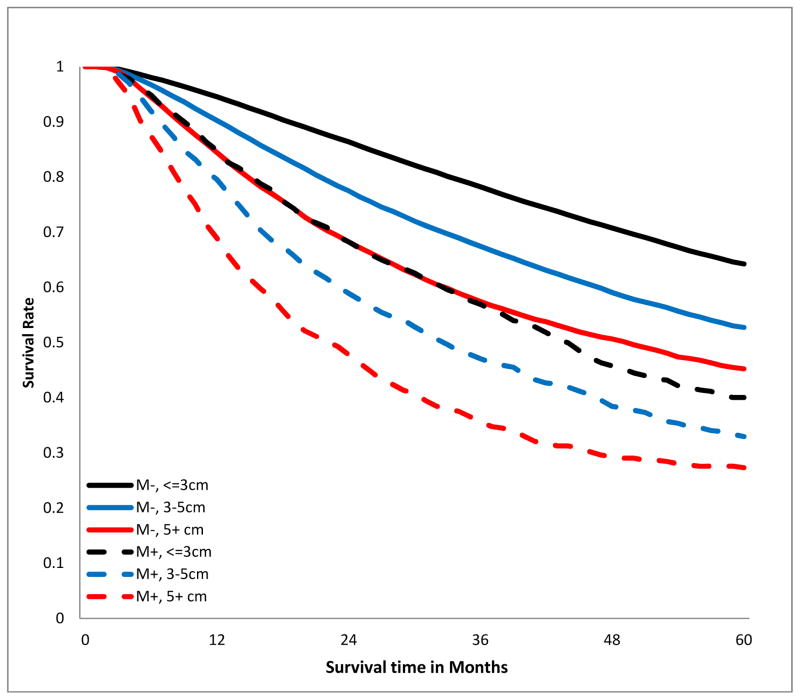
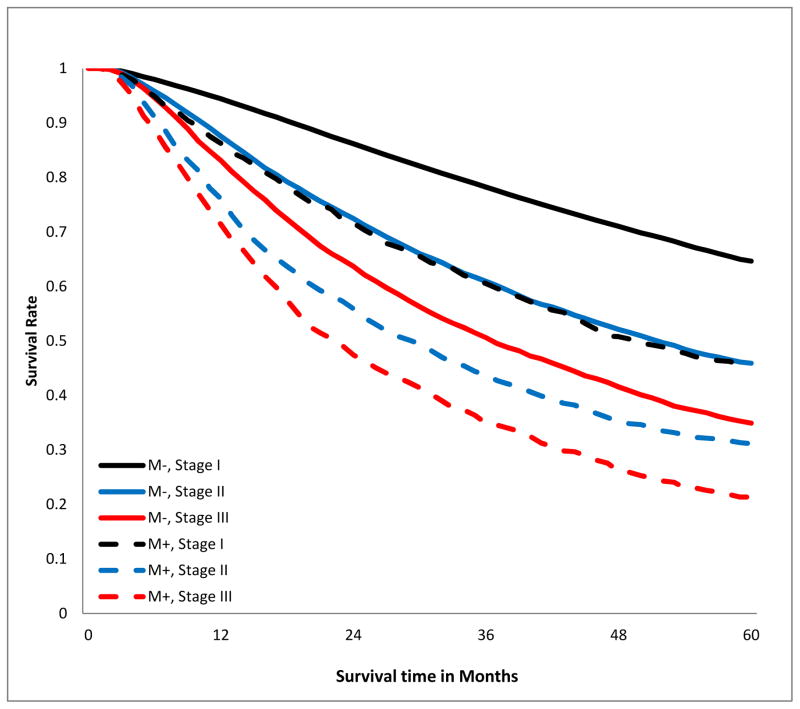
Figure 2.
Kaplan-Meier estimates of 5-year overall survival curves stratified by margin status. A.)Crude; B.) stratified by T-category; C.) stratified by tumor size; D.) stratified by American Joint Committee on Cancer aggregate Tumor Node Metastasis stage. M−, margin-negative patients; M+ margin-positive patients.


