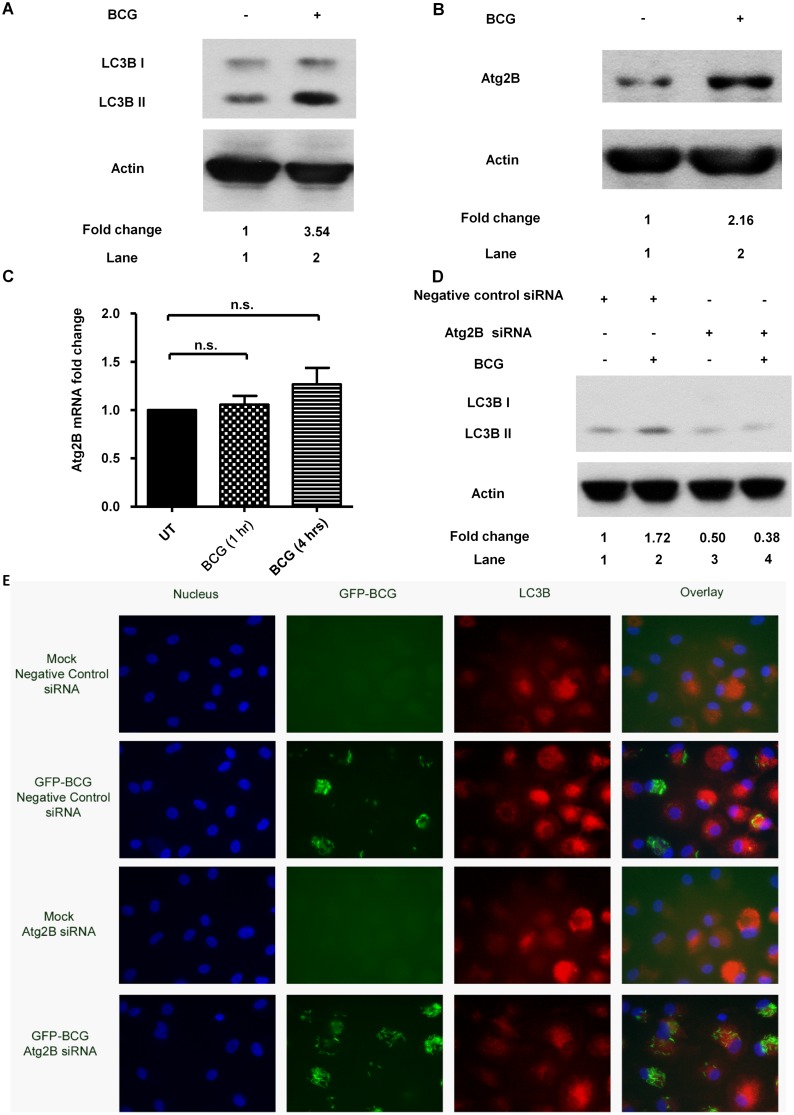
Fig 3. BCG induces autophagy which involves ATG2B.
(A) PBMacs were treated with BCG (MOI = 1) for 24 hrs. Cell lysates were examined by Western blot using anti-LC3B or anti-actin antibodies, as indicated. The results shown are representative of independent experiments using PBMac from four individuals. The intensity of the relevant bands was quantified by laser densitometry. The ratio of intensities of LC3B-II/actin in each sample was compared with that in cells treated with Mock. (B) PBMacs were treated with BCG (MOI = 1) for 24 hrs. Cell lysates were examined by Western blot using anti-Atg2B or anti-actin antibodies, as indicated. The results shown are representative of independent experiments using PBMacs from three individuals.The intensity of the relevant bands was quantified by laser densitometry. The ratio of intensities of Atg2B/actin in each sample was compared with that in cells treated with Mock. (C) PBMacs were treated with Mock (diluent for BCG) for 1 hrs and 4 hrs respectively and BCG (MOI = 1) for indicated intervals. The Atg2B mRNA levels normalized to that of GAPDH were analyzed by quantitative PCR. The Atg2B mRNA levels in cells were expressed as fold change to those in Mock-treated cells. The data are expressed as the mean ±SEM of independent experiments using PBMacs from seven individuals. n.s., not significant. (D) PBMacs were transfected with Atg2B siRNA (200 nM) or negative control siRNA (200 nM) for 48 hrs, followed by BCG (MOI = 1) treatment for 24 hrs. Cell lysates were examined by Western blot using anti-LC3B or anti-actin antibodies, as indicated. The results shown are representative of independent experiments using PBMac from four individuals. The ratio of intensities of LC3B-II/actin in each sample was compared with that in cells treated with Mock and negative control siRNA. (E) PBMacs were transfected with Atg2B siRNA (200 nM) or negative control siRNA (200 nM) for 48 hrs, followed by GFP-BCG (MOI = 1) treatment for 24 hrs. PBMacs were then fixed and stained with anti-LC3B antibodies and DAPI. Images were taken with a Carl Zeiss fluorescence microscope system in independent experiments using PBMacs from four individuals. Representative images from five fields per well are shown.

