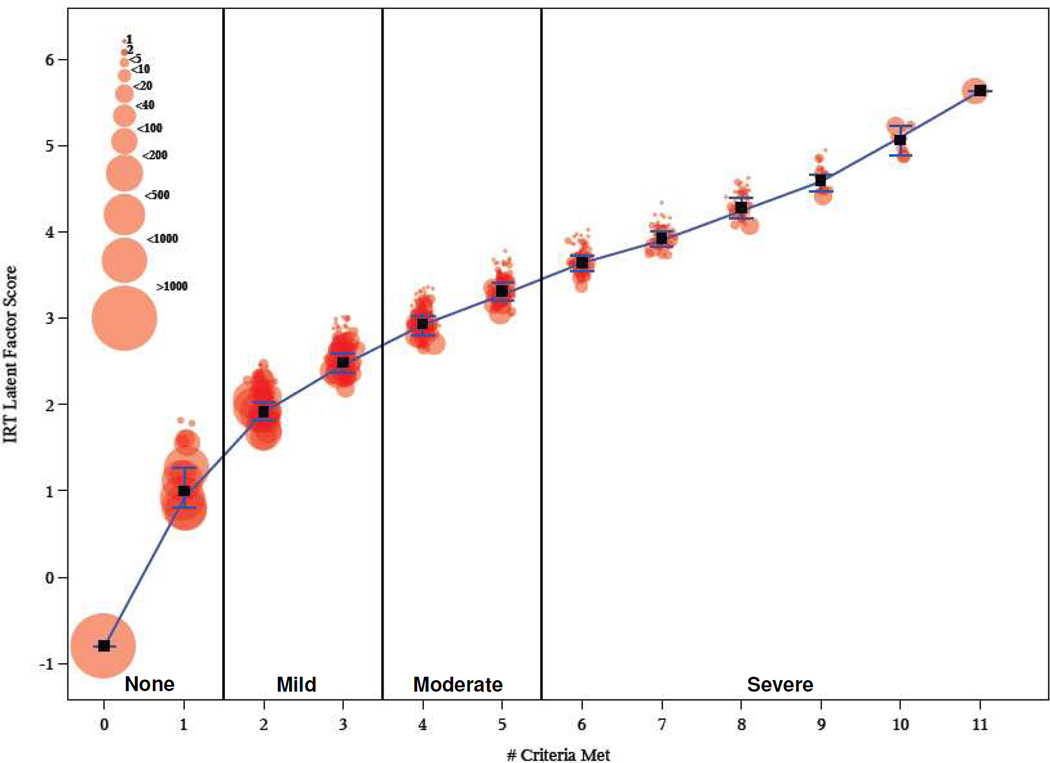
Figure 1.
Plot of the different criteria permutation (from 0 to 11) and corresponding average IRT latent factor severity scores across groups. Note: Connected line represents the weighted median value across all combinations of criteria at each level of number of criteria endorsed for the four different severity measures. Vertical lines at each level represent 25th and 75th percentiles. Squares denote the weighted mean at each level across all combinations. Circles represent weighted mean values of each of the severity measures for particular unique combinations of criteria at each level. Circles are jittered for ease of presentation.

