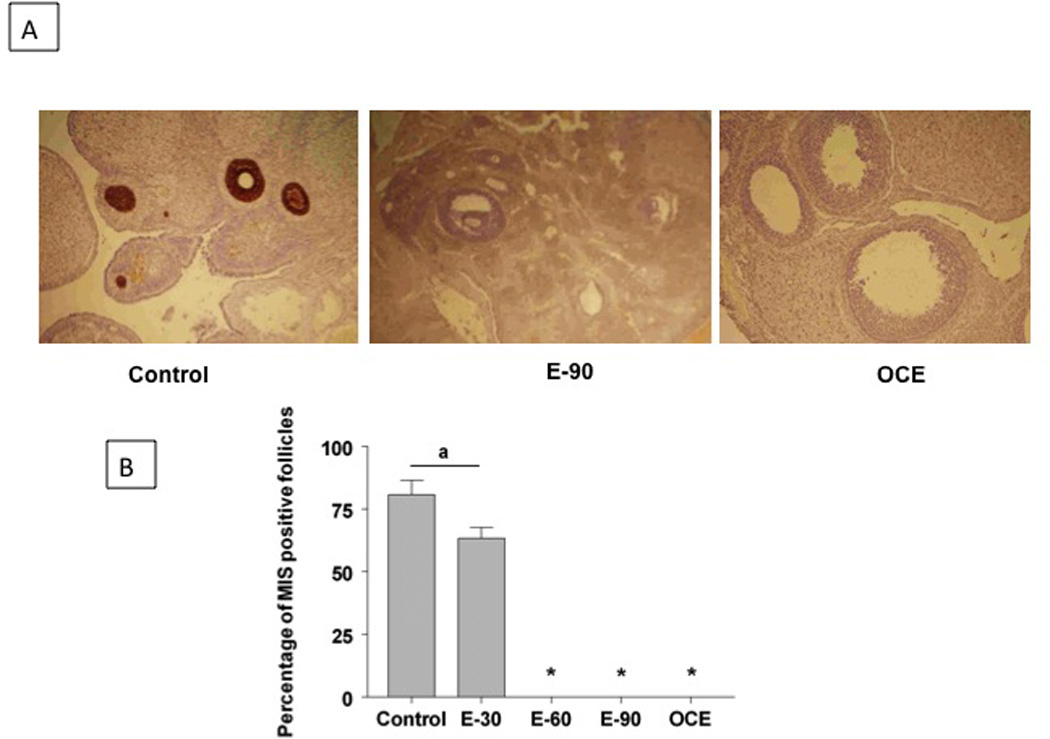
Figure 4.

(A) MIS immunohistochemistry in ovaries from control and E2 treated animals. Panel 1: Section from a control ovary. There was strong MIS immunoreactivity in primary, secondary, and small tertiary follicles. Panel 2 and 3: Sections from a E90 ovary and OCE ovary respectively. (B) Effect of E2 treatment on the percentage of follicles expressing MIS immunoreactivity. Total number of follicles counted ranged from 65–85 in the different groups * indicates significant decrease from control. p<0.05.
