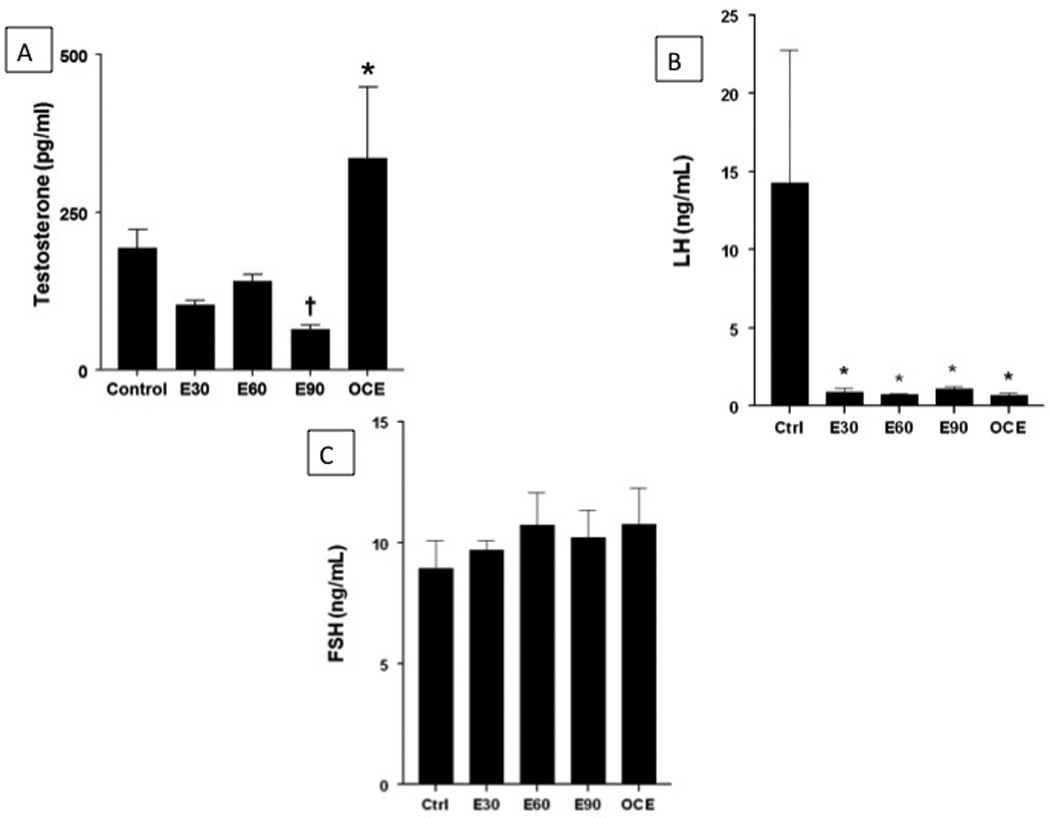
Figure 6.

(A) Effect of E2 exposure on serum testosterone levels. * indicates significant difference from the rest of the groups. † indicates significant decrease from control and OCE groups. p<0.05. (B) Effect of E2 exposure on serum LH levels. * indicates significant difference from control. (C) Effect of chronic E2 exposure on serum FSH levels.
