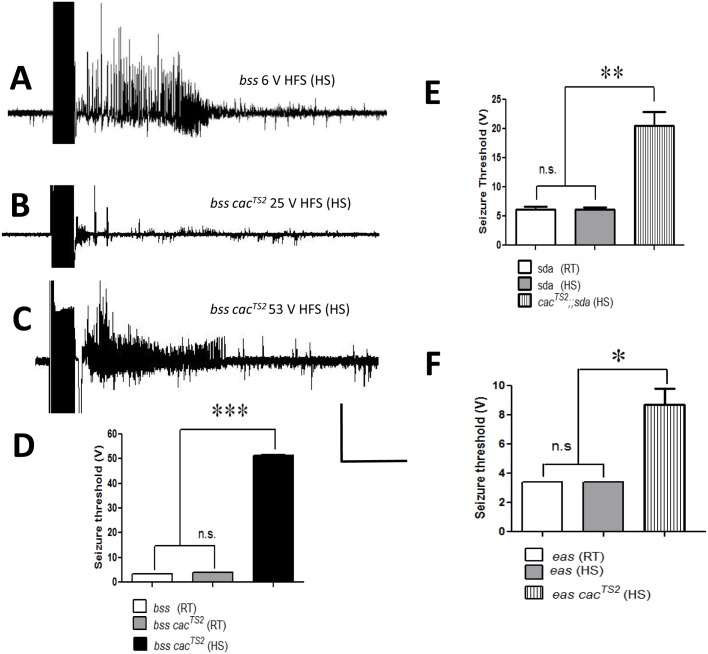
Fig 3. Electrophysiology of cacTS2 suppression.
A. Electrical recording from a parabss1 DLM fiber showing seizure-like activity evoked by a 6 V HFS stimulation, showing that the single BS mutant has a low seizure threshold. B. Electrical recording from a parabss1 cacTS2 DLM fiber showing that stimulation at 25 V HFS is below threshold and fails to evoke a seizure event in the double mutant indicating suppression by cacTS2. C. Electrical recording from a parabss1 cacTS2 DLM fiber showing that a high voltage stimulation at 53 V HFS is above threshold and evokes a seizure-like event in the double mutant. For the traces depicted in A-C, the HFS stimulus is delivered immediately after HS (3 min at 30°C). D. At room temperature (RT; steady state), seizure threshold for the parabss1 cacTS2/Y double mutant (gray bar) is similar to the parabss1/Y single mutant (white bar). Immediately following a HS, seizure threshold for parabss1 cacTS2/Y is transiently high indicating suppression (black bar; n = 7). E. Average seizure threshold is increased by about a factor of 4 in cacTS2/Y;;sda double mutants following a brief HS (striped bar; 20.5 ± 2.42 V HFS; n = 7) compared to hemizygous sda single mutant (white and gray bars). F. Average seizure threshold is increased by about a factor of 3 in hemizygous double mutant eas cacTS2/Y following a brief HS (striped bar; 8.7 ± 1.1 V HFS; n = 11) compared to the eas single mutant (white and gray bars). Quantitative data are represented as mean ± s.e.m. *P < 0.01, **P = 0.001, ***P < 0.0001, (D-F) chi-square test. Horizontal calibration: 800 msec for A-C; Vertical calibration: 20 mV for A-C.

