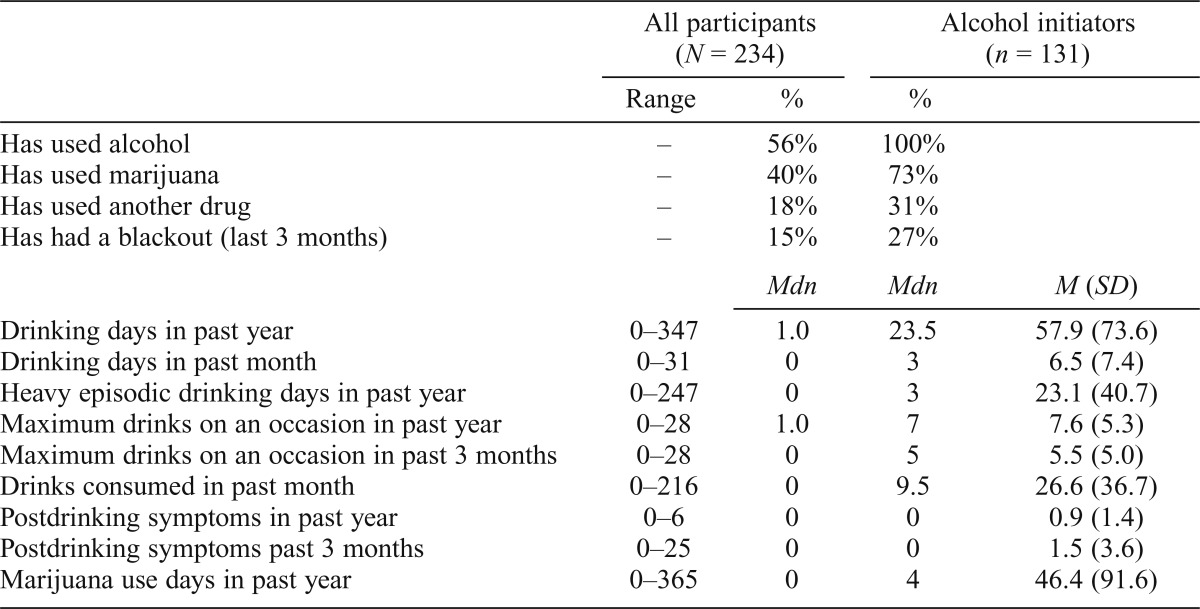
Table 4.
Range, median, mean, and standard deviations of follow-up substance use variables
| All participants (N = 234) |
Alcohol initiators (n = 131) |
|||
| Range | % | % | ||
| Has used alcohol | – | 56% | 100% | |
| Has used marijuana | – | 40% | 73% | |
| Has used another drug | – | 18% | 31% | |
| Has had a blackout (last 3 months) | – | 15% | 27% | |
| Mdn | Mdn | M (SD) | ||
| Drinking days in past year | 0–347 | 1.0 | 23.5 | 57.9 (73.6) |
| Drinking days in past month | 0–31 | 0 | 3 | 6.5 (7.4) |
| Heavy episodic drinking days in past year | 0–247 | 0 | 3 | 23.1 (40.7) |
| Maximum drinks on an occasion in past year | 0–28 | 1.0 | 7 | 7.6 (5.3) |
| Maximum drinks on an occasion in past 3 months | 0–28 | 0 | 5 | 5.5 (5.0) |
| Drinks consumed in past month | 0–216 | 0 | 9.5 | 26.6 (36.7) |
| Postdrinking symptoms in past year | 0–6 | 0 | 0 | 0.9 (1.4) |
| Postdrinking symptoms past 3 months | 0–25 | 0 | 0 | 1.5 (3.6) |
| Marijuana use days in past year | 0–365 | 0 | 4 | 46.4 (91.6) |

