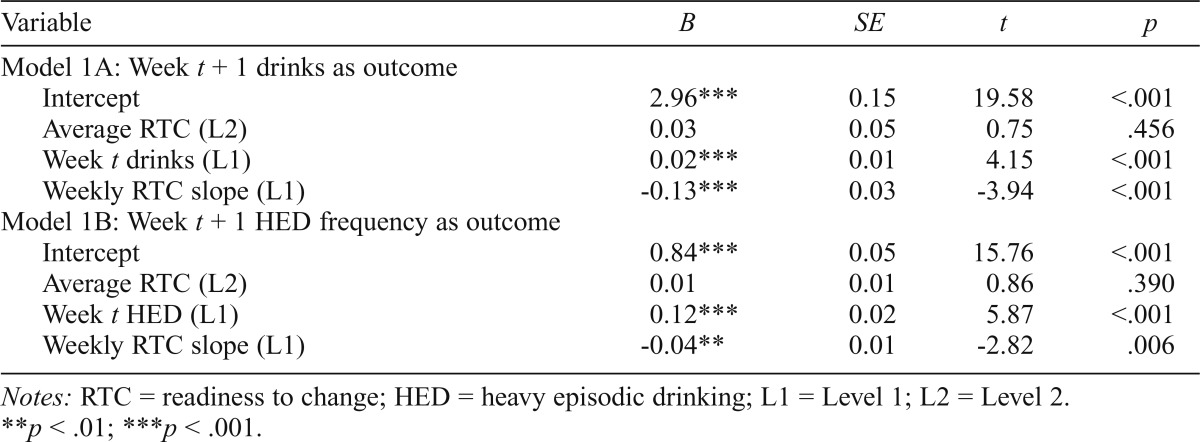
Table 2.
Hierarchical linear models examining associations between weekly readiness to change and subsequent alcohol use
| Variable | B | SE | t | p |
| Model 1A: Week t + 1 drinks as outcome | ||||
| Intercept | 2.96*** | 0.15 | 19.58 | <.001 |
| Average RTC (L2) | 0.03 | 0.05 | 0.75 | .456 |
| Week t drinks (L1) | 0.02*** | 0.01 | 4.15 | <.001 |
| Weekly RTC slope (L1) | -0.13*** | 0.03 | -3.94 | <.001 |
| Model 1B: Week t + 1 HED frequency as outcome | ||||
| Intercept | 0 g4*** | 0.05 | 1 5.76 | <.001 |
| Average RTC (L2) | 0.01 | 0.01 | 0.86 | .390 |
| Week t HED (L1) | 0.12*** | 0.02 | 5.87 | <.001 |
| Weekly RTC slope (L1) | -0.04** | 0.01 | -2.82 | .006 |
Notes: RTC = readiness to change; HED = heavy episodic drinking; L1 = Level 1; L2 = Level 2.
p < .01;
p < .001.

