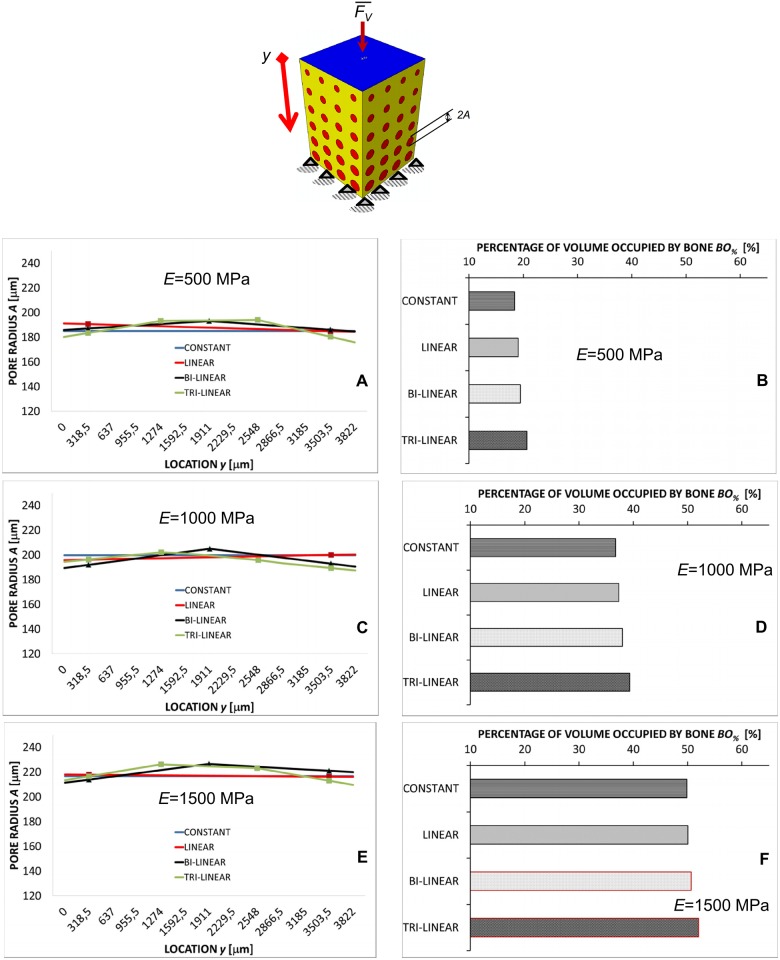
Fig 4. Computed values of A and BO% in the case of compression loading.
Pore radius A (A, C, E) (vs. location y) and percentages of the scaffold volume occupied by bone BO% (B, D, F) predicted by the optimization algorithm in the case of compression loading FV for different scaffold Young’s moduli and after implementing different porosity distribution laws. The schematic figure shown on the top indicates the loading condition to which the diagrams refer. All the values of BO% reported in the diagrams refer to the optimal configuration, i.e. the configuration for which Ω reaches its minimum value.

