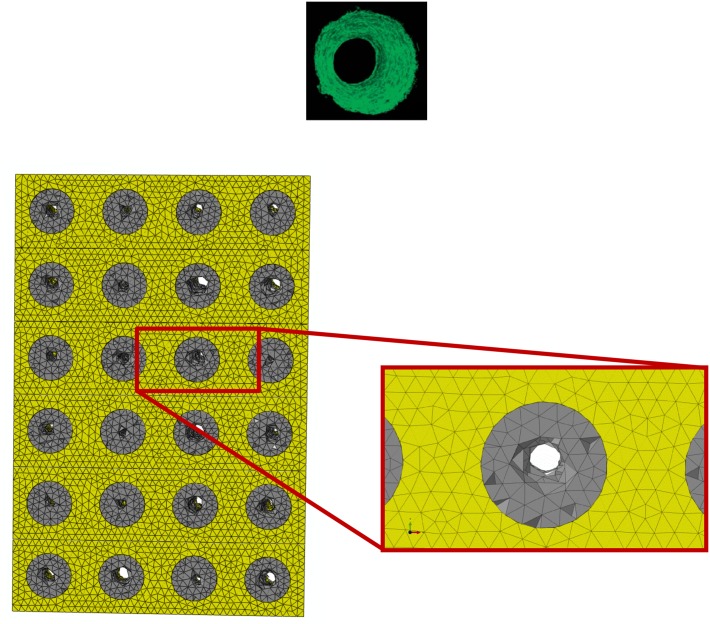
Fig 10. Patterns of bone predicted in the case of: (i) compression loading; (ii) scaffold Young’s modulus E = 1000 MPa; (iii) porosity distribution law: constant.
Elements in gray are representative of the regions within the scaffold pores where the algorithm predicts bone formation. Interestingly, the predicted bony tissue patterns appear consistent with those of new tissue formed in three-dimensional matrix channels observed in an in vitro study [39]. Bone formation starts from the pore walls and propagates towards the pore center.

