
Figure 3. Quantitative Scans of Lipoprint Polyacrylamide Gels.
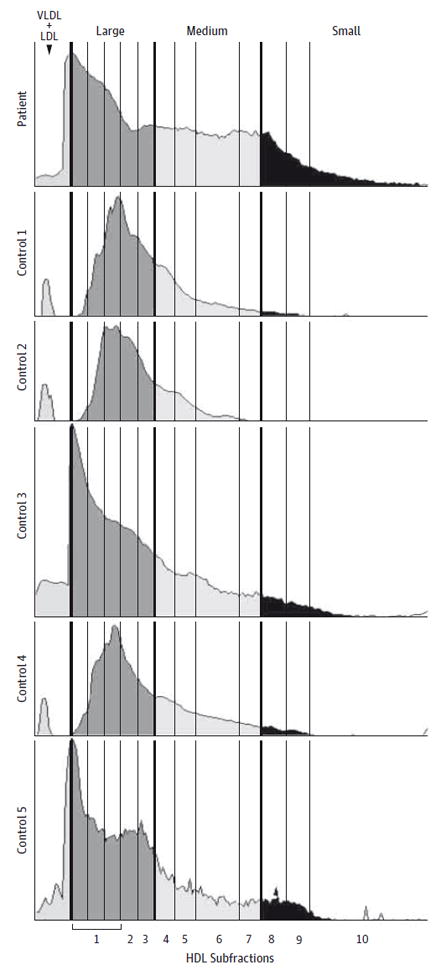
High-density lipoprotein (HDL) subfractions from the patient are compared with 5 representative control samples, measured as the scanned density of Sudan black–stained lipids. There is an abnormal HDL size distribution compared with control samples, with the patient’s HDL having a much higher proportion of small particles (fractions 8, 9, and 10). There is some increase in medium-sized particles (fractions 4, 5, 6, and 7). There is a correspondingly lower percentage in the largest particles (fractions 1, 2, and 3). LDL indicates low-density lipoprotein; VLDL, very low-density lipoprotein.