Fig. 1.

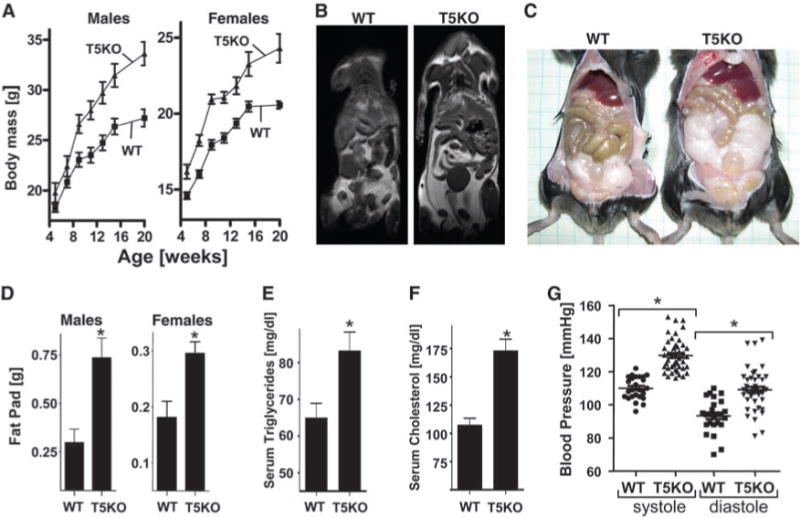
T5KO mice develop obesity. T5KO mice and WT littermates were monitored for 20 weeks. (A) Body mass. (B) MRI image showing fat distribution. (C) Abdominal photograph of representative 20-week-old male mice. (D) Fat-pad mass. (E) Serum triglycerides. (F) Serum cholesterol. (G) Blood pressure. Results in (A) to (C) are from an individual experiment (n = 20, 10 males and 10 females) and representative of more than six distinct groups of mice. Results in (B) are representative of three separate analyses performed on mice that had median body mass of their litters. Results in (C) to (E) are from a single experiment (n = 6) and representative of several experiments. Results in (G) compare groups (n = 4) of mice with 5 to 10 independent measurements per mouse. *, P < 0.05.
