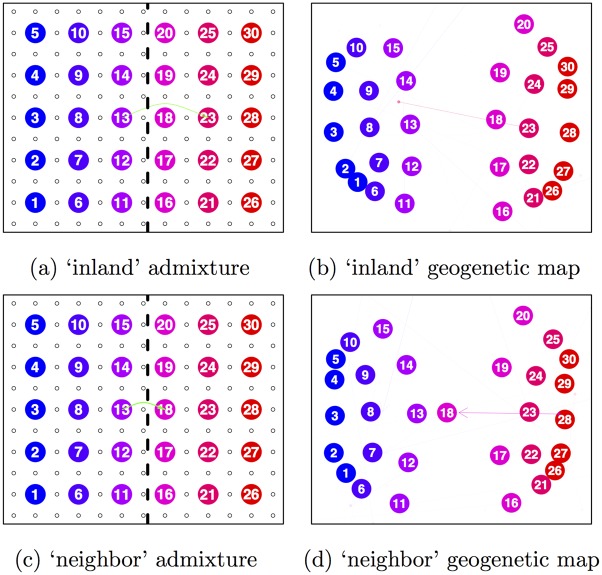
Fig 4. Simulation scenarios and inferred population maps for two different admixture scenarios.
Green arrows denote admixture from a source to a target population in the simulation. a) lattice with a barrier and an admixture event (10%) across the barrier to an ‘inland’ population; b) the inferred population map for the scenario in (a), where the admixed population 23 is the only population drawing non-negligible admixture (95% CI: 0.02-0.08); c) lattice with a barrier and an admixture event (40%) across the barrier to a ‘neighbor’ population on the border of the barrier; (d) the inferred population map for the scenario in (c), where the admixed population 18 is the only population drawing non-negligible admixture (95% CI: 0.04–0.14).

