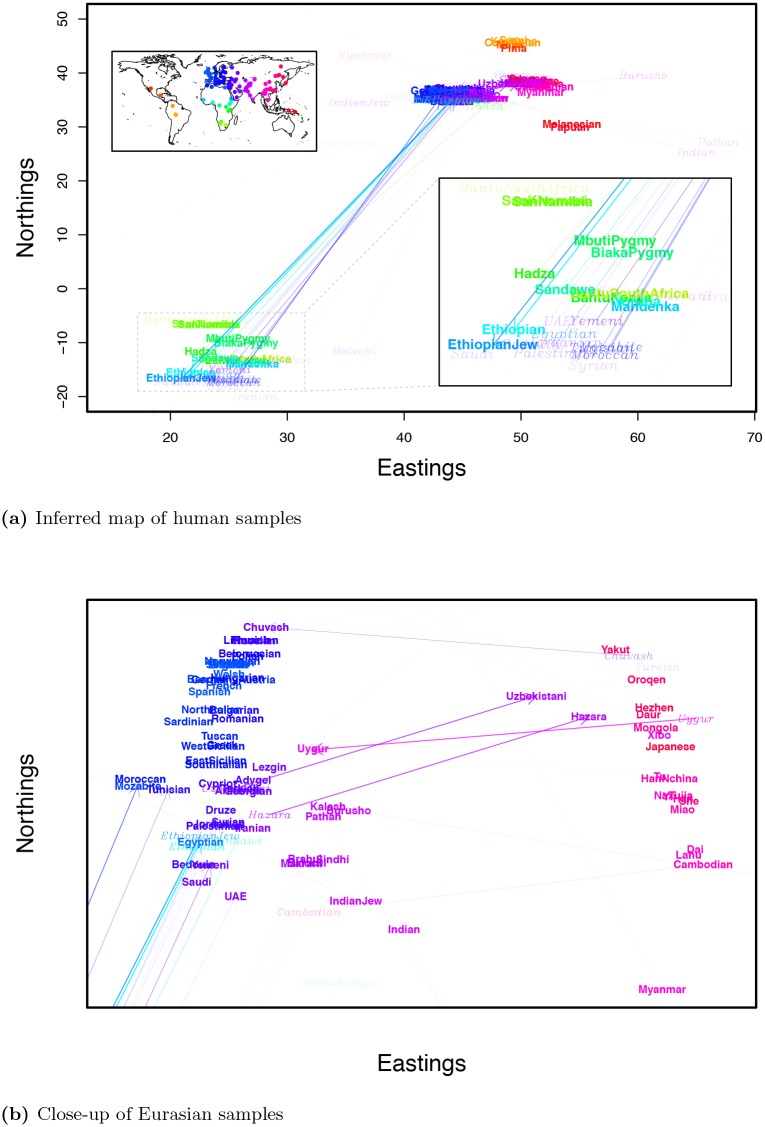
Fig 9. Geogenetic map of human samples, inferred with admixture.
Labels are colored as in as in Fig 5b. Italicized labels denote locations of admixture sources, with opacity proportional to the amount of admixture drawn by the sample. a) complete map; b) close-up of Eurasian samples.

