
Fig 3. Risk of leptospiral infection within the Pau da Lima study site at each of four annual repeated measures during prospective follow-up of the community cohort.
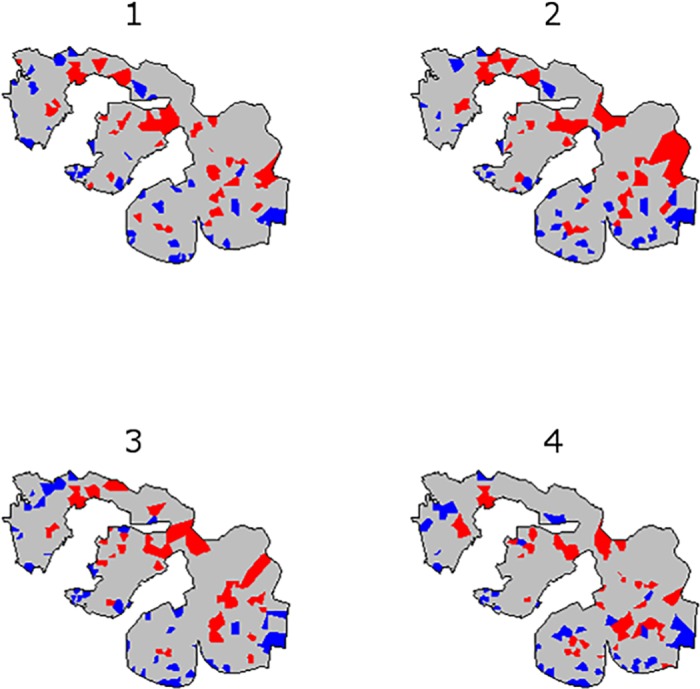
The choropleth map indicates the 50 areas with highest odds of infection (red) and the 50 areas with lowest odds of infection (blue) at each follow-up period.