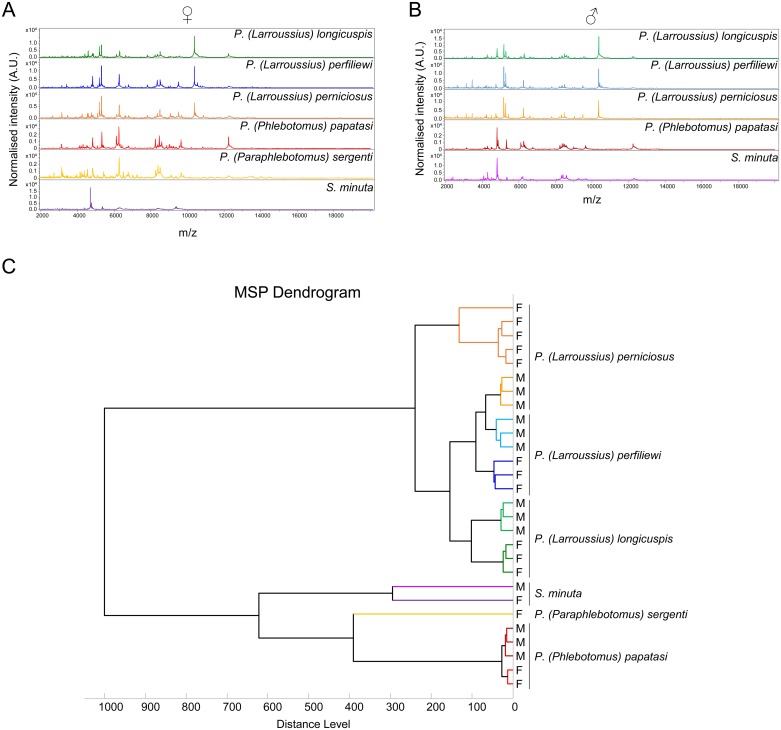
Fig 2. Comparison of MALDI-TOF MS spectra from thorax, leg and wing protein extraction of the six sand fly species ranging from 2 to 20 kDa.
Representative spectra of females (A) and male (B) specimens are shown. The sand fly species are indicated in the right corner of each protein profile spectrum. (C) Dendrogram constructed with the 28 specimens selected for database creation (Table 2). The dendrogram was calculated by Biotyper 3.0 software and distance units correspond to the relative similarity of MS spectra. Color code is the same for each sand fly species.

