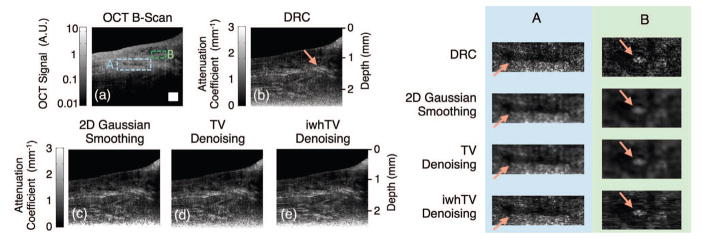
Fig. 6.
(a) Original OCT B-scan of ex-vivo porcine bladder tissue used for creating reconstructions of the attenuation coefficient; boxed portions mark positions of magnified views shown in the table on the right. Reconstructions were created using (b) DRC, (c) DRC with 2D Gaussian Smoothing, (d) DRC with TV denoising, and (e) DRC with iwhTV denoising. The arrow in (b) indicates a region of high attenuation coefficient not obvious in the original B-scan. The arrows in columns A and B indicate boundaries that are retained with iwhTV but blurred by other techniques. The white square in (a) represents 250 × 250 μm2.

