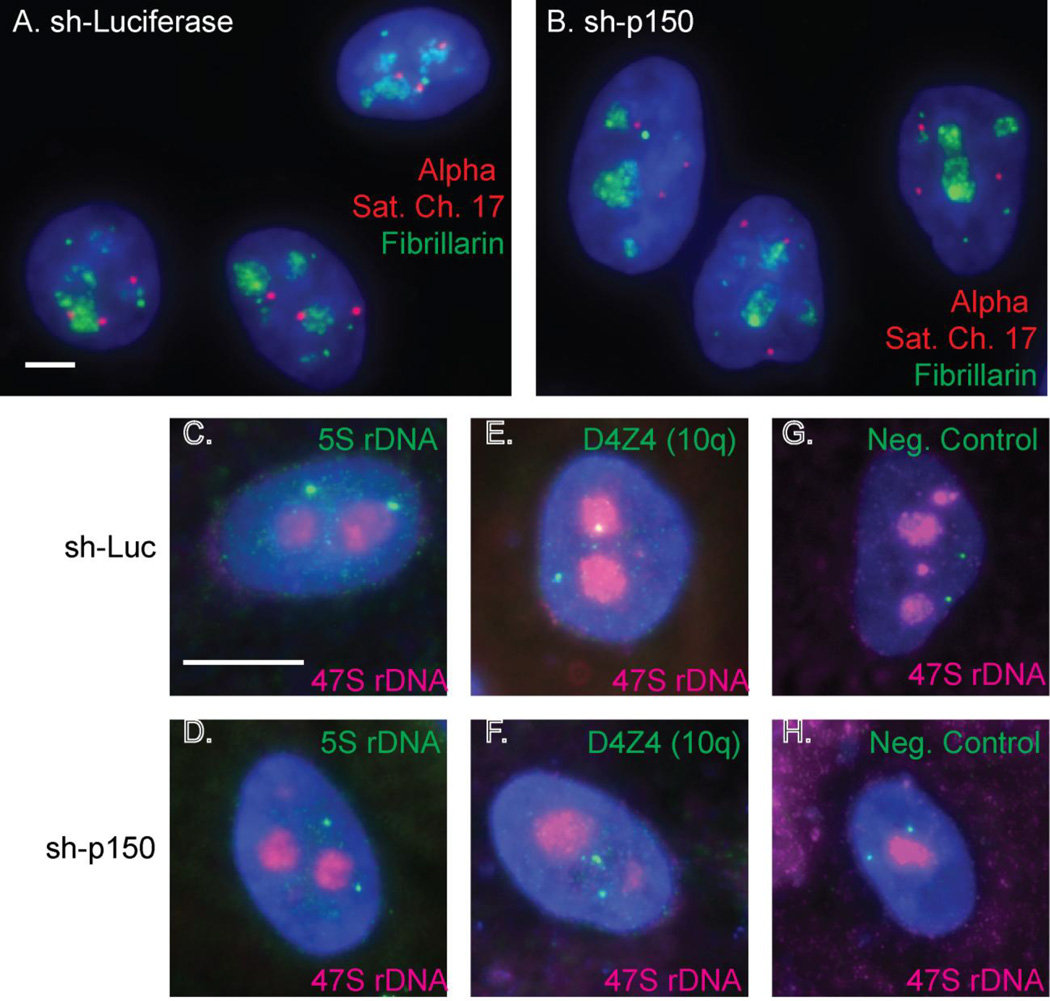
Figure 1. CAF-1 p150 is required for normal localization of several repetitive elements to the perinucleolar region.
Panels A–B: DNA-FISH analysis of HeLa cells, showing proximity of chromosome 17 alpha satellite DNA (red) to nucleoli (fibrillarin, green) in cells expressing a shRNA directed against luciferase (A) or CAF-1 p150 (B). Panels C–H: DNA-FISH analysis of MCF-10A cells displaying proximity of nucleoli (rDNA, red) to the 5S rDNA array (C and D), the D4Z4 array on chromosome 10q (E and F), or a non-NAD negative control BAC from 10q (Németh et al. 2010) (G and H). Cells expressed an shRNA directed against luciferase (panels C, E, G) or CAF-1 p150 (panels D, F, H). The scale bar is 5 µm in panel A and 10 µm in panel C. Methods, probes, and antibodies described in (Smith et al. 2014).

