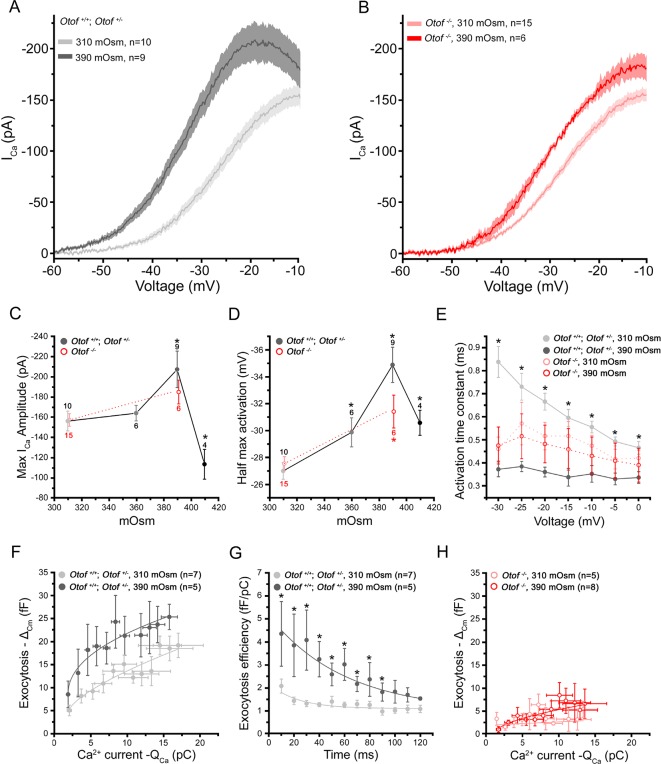
Figure 3. Intracellular hydrostatic pressure modulates Ca2+ currents and exocytosis.
(A) Comparative Ca2+ currents evoked by a voltage-ramp protocol in Otof+/- and Otof+/+IHCs (expressing otoferlin). Cells were recorded with intracellular osmotic pressure at 310 mOsm (n = 10) or at 390 mOsm (n = 9). The darker line indicates the mean responses and the light filled area the standard error. (B) Ca2+ currents in Otof-/- IHCs (lacking otoferlin) recorded in conditions similar to A. (C-D) Both maximum amplitude and half-maximum voltage-activation of Ca2+ currents were maximally affected at 390 mOsm. Note that the slopes of the Boltzman fit of the activation curve in A and B were found slightly affected in IHCs expressing otoferlin (310 mOsm: K = 5.90 ± 0.14 pA/mV, n = 10 and 390 mOsm: K = 5.36 ± 0,09 pA/mV, n = 9; p < 0.05) but not in Otof-/-IHCs (310 mOsm: K= 6.18 ± 0.20 pA/mV, n=6 and 390 mOsm: K= 5.89 ± 0.28, n = 6; p = 0.71) (data not shown). Data are represented as mean ± SEM, with the number of cells indicated above each point and (*) indicating p < 0.05. (E) Activation kinetics of Ca2+ currents, evoked by voltage-steps from -80 mV to different voltage levels, were significantly faster at 390 mOsm in hair cells expressing otoferlin but not in Otof-/- IHCs. For unknown reason the activation kinetics were faster in Otof-/-IHCs as compared to IHCs expressing otoferlin. Data are expressed as mean ± SEM. * p < 0.05. The number of cell is similar to D. (F) Ca2+ efficiency of exocytosis was plotted as the change in membrane capacitance (ΔCm) against the integral of the calcium current (QCa) when depolarizing IHCs at a constant voltage-step from -80 to -10 mV with increasing duration from 10 to 120 ms. Data points at 310 mOsm and 390 mOsm were fitted with a power function with a Ca2+ efficiency slope A = 2.47 ± 0.45 fF/pC and 9.30 ± 2.5 fF/pC (p < 0.05) and a (power cooperative index) = 0.33 and 0.51 (p = 0.52), respectively. The supralinear power cooperative index of 0.3 and 0.51 found here was somewhat lower to previous values reported by Cho et al. (2011) and Johnson et al (2005). (G) The exocytotic efficiency of each data point in F (ΔCm/QCa) was plotted for each depolarizing time at 310 mOsm and 390 mOsm. Data were fitted with an exponential function with 22.2 ± 10.4 ms and 50.1 ± 11.9 ms, respectively (p < 0.05). (H) Ca2+ efficiency of exocytosis (recorded in conditions similar to F) was unaffected when rising osmotic pressure from 310 to 390 mOsm in Otof-/-IHCs. Data were best fitted with a linear function with a similar slope of 0.12 ± 0.1 fF/pC and 0.48 ± 0.1 fF/pC (p = 0.2) at 310 and 390 mOsm, respectively. Data are represented as mean ± SEM. * p < 0.05.

