. 2015 Oct 5;4:e09771. doi: 10.7554/eLife.09771

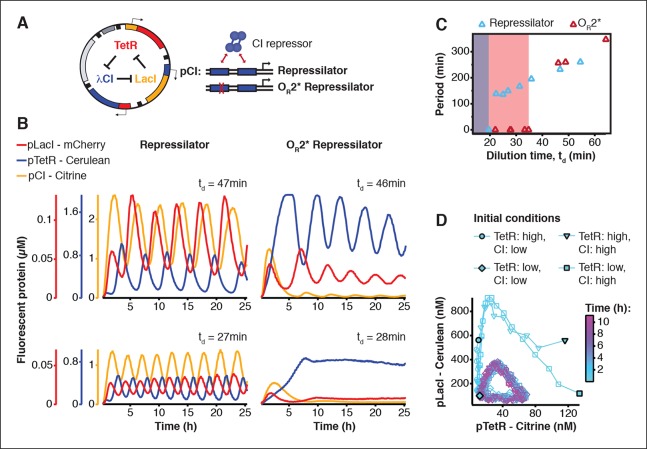
Figure 2. Cell-free repressilator characterization.

(A) Application of cell-free systems to characterize the original repressilator (Elowitz and Leibler, 2000) and a modified version with a point mutation in the CI promoter (OR2*) located in one of the binding sites of the CI repressor. (B) Expression from the three promoters of the repressilator and the OR2* version at different dilution times. (C) Oscillation periods of the repressilator as a function of dilution time. In the OR2* version sustained oscillations were supported in a narrower range of dilution times as compared to the original repressilator network. (D) Phase portrait of repressilator oscillations starting from different initial TetR and CI repressor concentrations.

DOI: http://dx.doi.org/10.7554/eLife.09771.006

Figure 2.

Figure 2—figure supplement 1. Oscillation parameter regime for a 3-node repressilator network in terms of dilution time and synthesis rates.
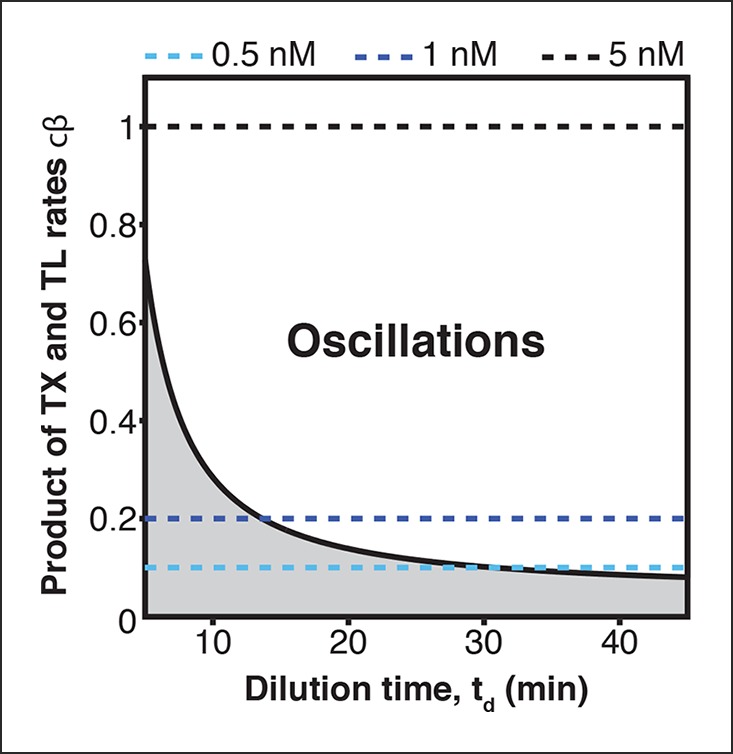
Figure 2—figure supplement 1.

Transcription (TX) and translation (TL) rates supporting oscillations at different dilution times for a 3-node repressilator network. Synthesis rates resulting from the plasmid concentrations used in Figure 2—figure supplement 2 are indicated by broken lines.
Figure 2—figure supplement 2. Existence of oscillations and periods for a 3-node repressilator network in terms of dilution time.
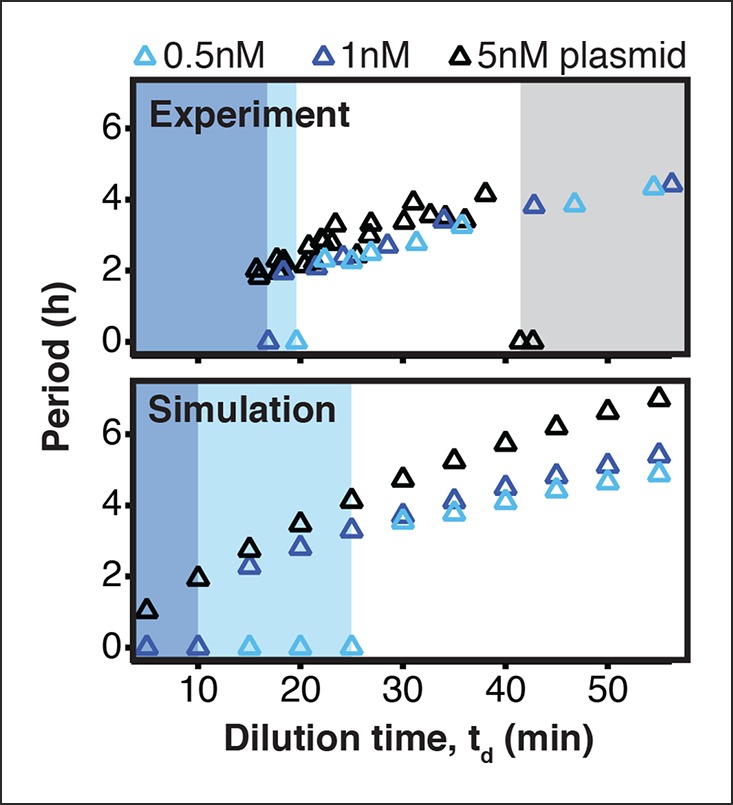
Figure 2—figure supplement 2.

We experimentally studied the effect of varying transcription rates on the repressilator network by measuring the range of dilution times that supported sustained oscillations. Transcription rates could be rapidly adjusted by varying DNA template concentrations of the repressilator plasmid. For different DNA template concentrations, oscillations occurred in different ranges of dilution times. Markers at a period of 0 hr indicate a stable steady state, and shaded regions highlight dilution times that did not support oscillations for a specific DNA template concentration. A simulation of the repressilator network produced similar results but did not capture loading effects on the biosynthetic machinery for high DNA template concentrations.
Figure 2—figure supplement 3. Oscillation parameter regime for a 3-node repressilator network in terms of dilution time and repressor binding affinity.
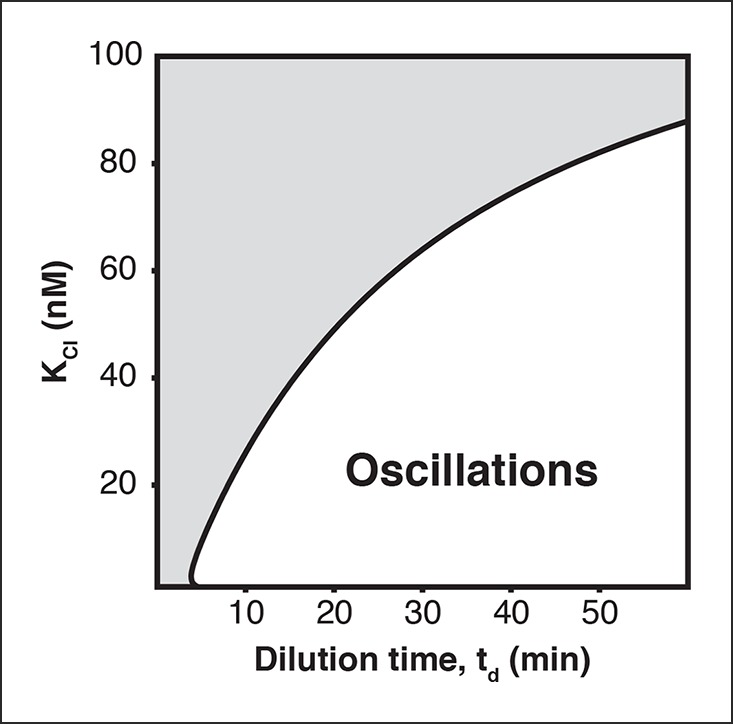
Figure 2—figure supplement 3.

Increasing the KM value, the repressor concentration needed for half-maximal repression, of one repressor, as for CI repressor in the OR2* repressilator version, reduces the range of dilution rates that support oscillations as indicated by our experimental results (Figure 2C).