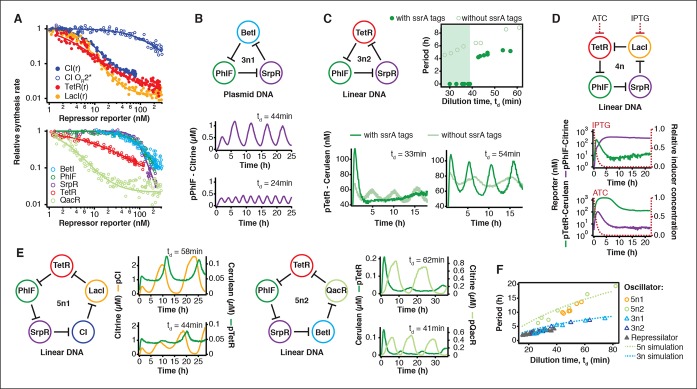
Figure 3. Cell-free prototyping and characterization of novel negative feedback circuits.
(A) Transfer functions of the repressilator repressor-promoter pairs (top) and TetR homologs (bottom). The TetR repressor was tested against two different promoters: the promoter used in the repressilator (top panel) and the J23119-TetR promoter (Stanton et al., 2014) (bottom panel). Lines are Hill function fits. (B) Oscillations of a novel 3-node ring oscillator (3n1) constructed on plasmid DNA. (C) Two versions of a second 3-node ring oscillator (3n2) on linear DNA were used to study the effect of ClpXP degradation on oscillator function. One version was ssrA-tagged on all repressor genes while the other version did not carry degradation tags on the repressors. The same reporter with a medium-strength degradation tag was used in both versions. (D) A 4-node cyclic negative feedback network on linear DNA has two stable steady states that depend on the initial conditions. IPTG switched the network into the state where pPhlF was on and pTetR off. An initial pulse of aTc resulted in the opposite stable steady state. (E) Oscillations of two novel 5-node ring oscillators (5n1, 5n2) constructed on linear DNA. (F) 5-node ring oscillators oscillate with longer periods than 3-node ring oscillators, as predicted by simulations (Materials and methods) and shown by experimental data.
DOI: http://dx.doi.org/10.7554/eLife.09771.011
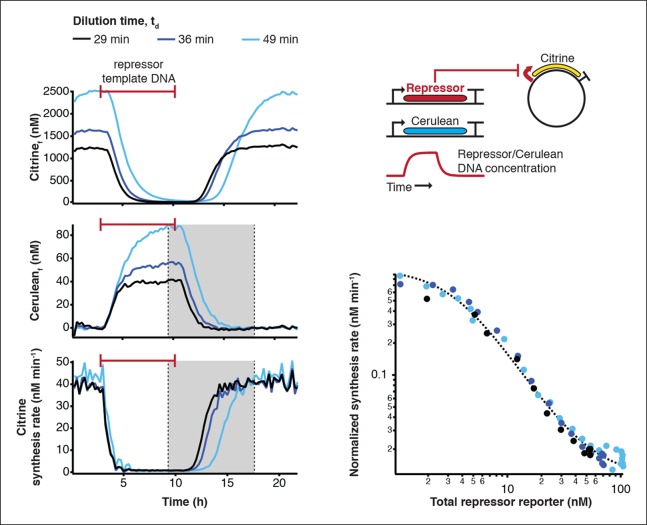
Figure 3—figure supplement 1. Measurement of transfer functions.
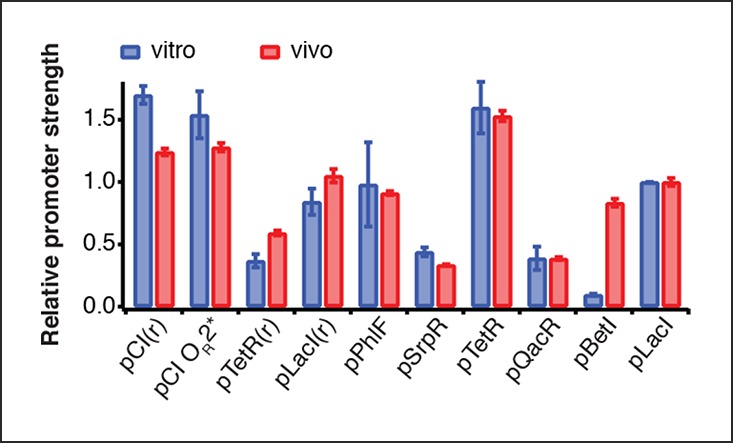
Figure 3—figure supplement 2. Comparison of relative promoter strengths in vitro and in vivo.

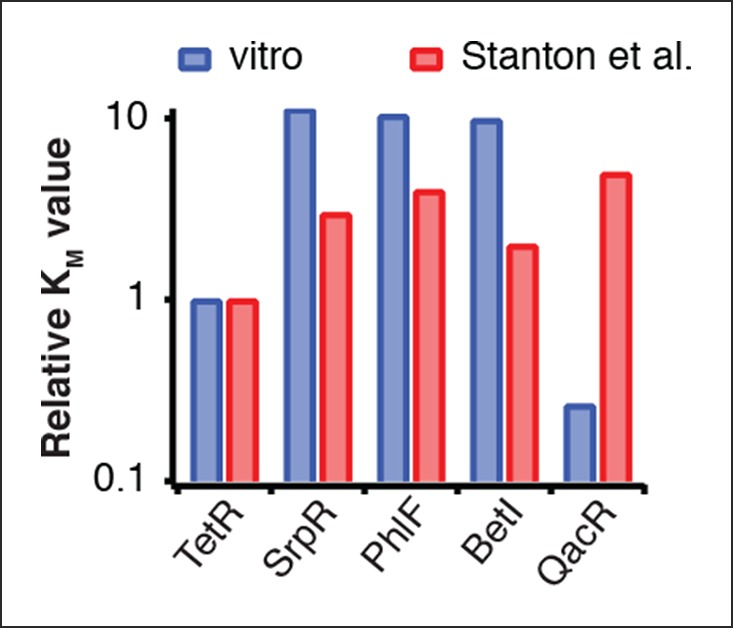
Figure 3—figure supplement 3. Comparison of half-maximal repressor concentrations needed for repression in vitro and in vivo.


