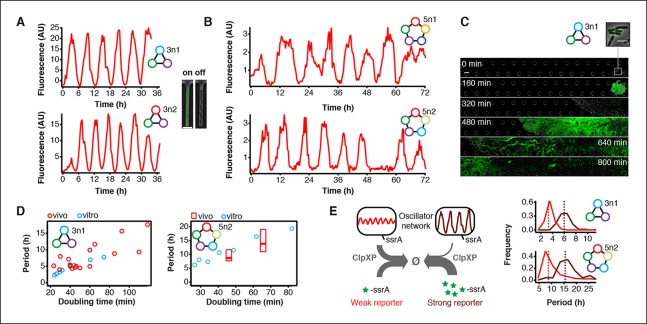
Figure 4. Novel 3-node and 5-node ring oscillators in cells.
(A) Time series traces of 3-node ring oscillators running in E. coli (mother machine). Single trap traces of 3n1 and 3n2 observed for 36 hr in vivo using a strong pPhlF sfGFP-ssrA reporter and a representative image from an ‘on’ and ‘off’ state of oscillation. Scale bar: 5 µm. (B) Time series traces of 5-node ring oscillators running in E. coli (mother machine). Single trap traces of 5n1 and 5n2 observed for 72 hr in vivo using a weak pPhlF sfGFP-ssrA reporter. (C) 3n1 displays population-wide oscillation pulses in vivo (CellASIC). Time series micrographs of 3n1 under a strong pPhlF sfGFP-ssrA reporter every 160 min; inset shows individual cells of the initial microcolony. Scale bar: 10 µm and 5 µm (inset). (D) Relationship between period and division time in vivo. Left, 3n1 in vivo under a strong pPhlF sfGFP-ssrA reporter. The in vitro data is shown for comparison. Each point in the in vivo data corresponds to the period and division time from aCellASIC experiment run under different media type and flow rates. Right, 5n2 in vivo under aweak pPhlF sfGFP-ssrA reporter. In vivo periods determined at 29ºC and 21ºC growth temperature in mother machine experiments. Boxes represent the inner quartile range with the median. (E) Influence of reporter concentration on oscillation periods by competing for ClpXP degradation. Left, with constant amounts of ClpXP the reporter concentration affects repressor degradation and thus oscillation period. Histograms of the periods observed with a weak and a strong pPhlF sfGFP-ssrA reporter for both 3n1 and 5n2 run in the mother machine. Dashed lines indicate the medians.
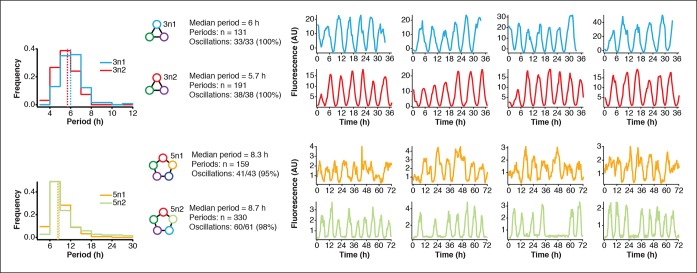
Figure 4—figure supplement 1. Robust oscillations of 3-node and 5-node oscillators in vivo.
Figure 4—figure supplement 2. Population-level oscillations of 3n2 oscillator in vivo.
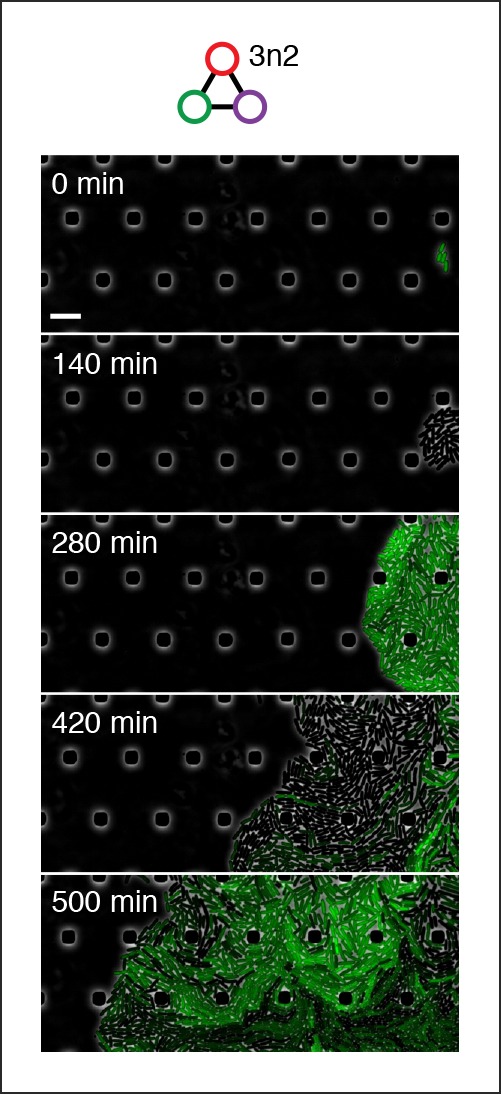
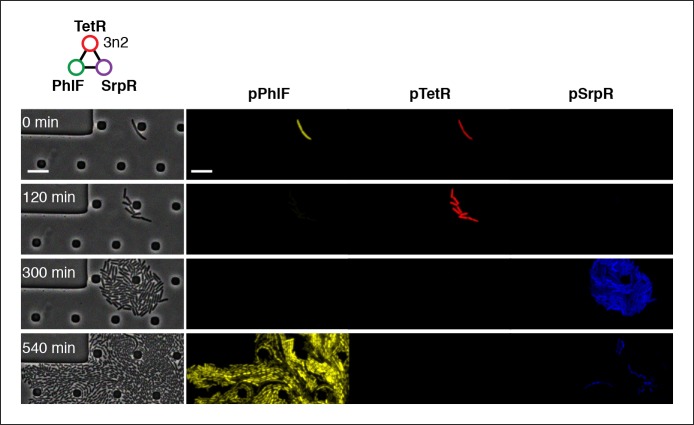
Figure 4—figure supplement 3. Three-color oscillations and population-level oscillations of 3n2 oscillator in vivo.
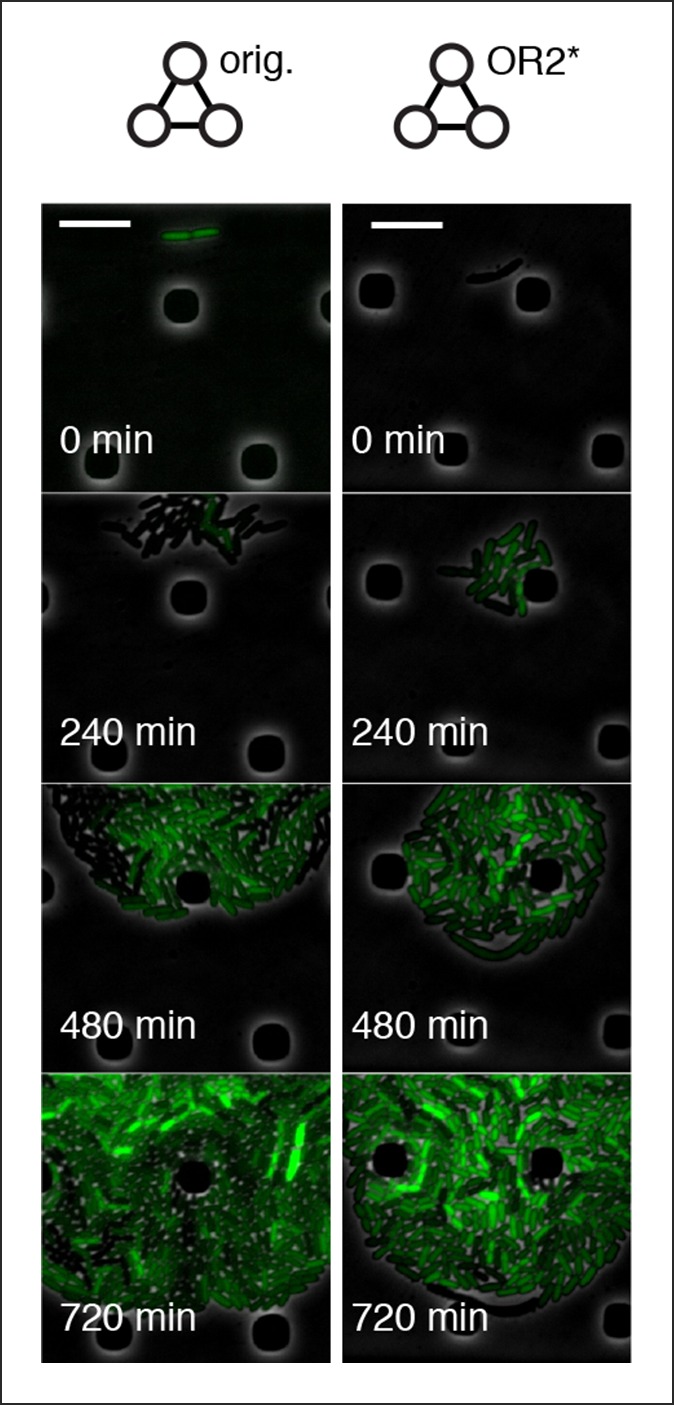
Figure 4—figure supplement 4. Original repressilator and OR2* mutant repressilator do not show population-level oscillations.
