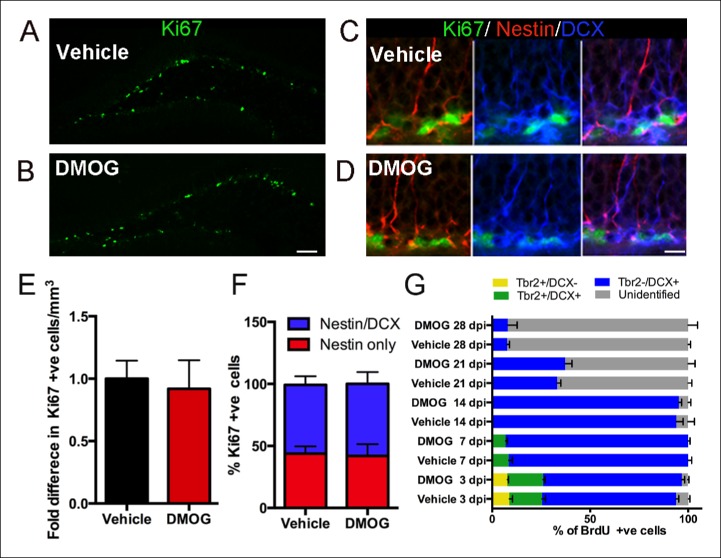
Figure 3. DMOG does not affect the proliferation and differentiation of 3 day old cells in the adult DG.
(A,B) Representative images of proliferating cells Ki67+ cells in the SGZ (A, B, scale bar: 100 μm). (C,D) Triple labeling with Ki67/ Nestin/DCX (C, D, scale bar: 10 μm). (E) The density of proliferating cells (Ki67+) was comparable between vehicle controls and DMOG treated animals. (F) The proportion of the DG proliferative progenitors remained unaltered following DMOG administration. (G) To analyze the phenotype of Brdu+ cells, brains were collected 3, 7, 14, 21 and 28 days after two pulses of BrdU (300 mg/kg with a 4 hr interval between doses) and triple labeled with BrdU/Tbr2/DCX. DMOG treatment did not affect the composition of the SGZ progenitor subtypes at any of the examined time-points. For all quantifications data are plotted as mean ± SD. The percentages at each time point are as follows: 3 dpi.: Control: 8.8 ± 3.2% Tbr2+/DCX-, 16.78 ± 3.6% Tbr2+/DCX+, 68.4 ± 2.7 Tbr2-/DCX+; DMOG: 7.8 ± 1.1% Tbr2+/DCX-, 18.8 ± 1.9% Tbr2+/DCX+, 70.7 ± 2.9% Tbr2-/DCX+. 7 dpi.: Control: 8.4 ± 3.2% Tbr2+/DCX+, 91 ± 3.1% Tbr2-/DCX+; DMOG: 6.8 ± 1.8% Tbr2+/DCX+, 93.2 ± 1.7%. 14 dpi.: Control, 94 ± 5.6% Tbr2-/DCX+; DMOG: 95 ± 2.5% Tbr2-/DCX+. 21 and 28 dpi.: Control: 21 dpi. 33 ± 3.2% Tbr2-/DCX+, 28 dpi. 7.6 ± 2% Tbr2-/DCX+; DMOG: 21 dpi 37.2 ± 6.2% Tbr2-/DCX+, 28 dpi. 7.9 ± 8.4% Tbr2-/DCX+.

