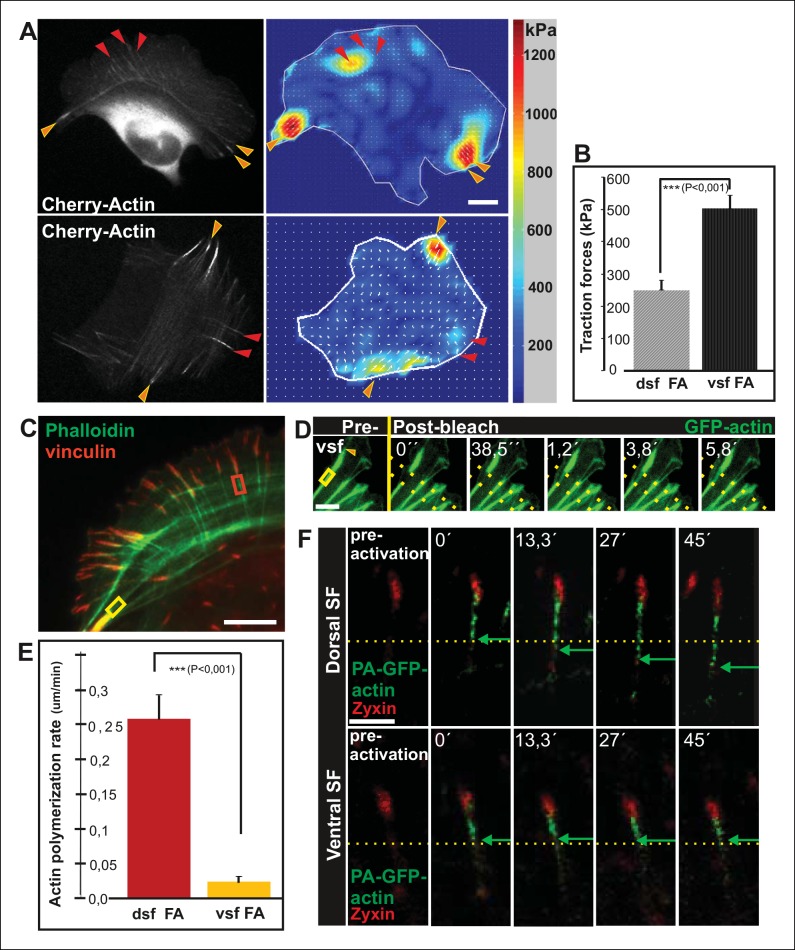
Figure 2. Vectorial actin polymerization at focal adhesions halts upon increased contractility and formation of ventral stress fibers.
(A) Representative images of U2OS cells grown on 26 kPa polyacrylamide dishes with fluorescent nanobeads together with the corresponding force maps. Adhesions located at the ends of ventral stress fibers (orange arrowheads) apply stronger forces to their substrate compared to adhesions located at the ends of dorsal stress fibers (red arrowheads). Bar, 10 um. (B) Quantification of traction forces at adhesions located in the ends of dorsal and ventral stress fiber adhesions. Mean +/- SEM, n = 20 cells, 4–8 adhesions per cell. (C) Recovery of GFP-actin signal was measured next to dorsal stress fiber adhesions (dsf FA, red box) and ventral stress fiber adhesions (vsf FA, yellow box). Bar, 5 um. (D) Representative example of a fluorescence-recovery-after-photobleaching (FRAP) experiment performed on a GFP-actin expressing cell at a ventral stress fiber (vsf) region close to a focal adhesion. Yellow box indicates the photobleached region and the orange arrowhead the distal end of the ventral stress fiber. Scale, 3 um. (E) Quantification of the recovery speed (μm/min) for GFP-actin from focal adhesions located at the tips of dorsal stress fibers (dsf) or ventral stress fibers (vsf). Means +/- SEM, n (dorsal stress fibers) = 11; n (ventral stress fibers) = 17. (F) Activation of PA-GFP-actin in focal adhesions is followed by centripetal flow of photoactivated actin along the dorsal stress fiber. In contrast, PA-GFP-actin activated at a focal adhesion located at the tip of ventral stress fiber does not distribute from the adhesion to the stress fiber. Activated PA-GFP-actin is in green, focal adhesion marker mCherry-zyxin in red and the yellow dashed lines show the borders of the photoactivated region. Bar, 2,5 μm.
Figure 2—figure supplement 1. Alignment of focal adhesions linked to the ends of transverse arcs.
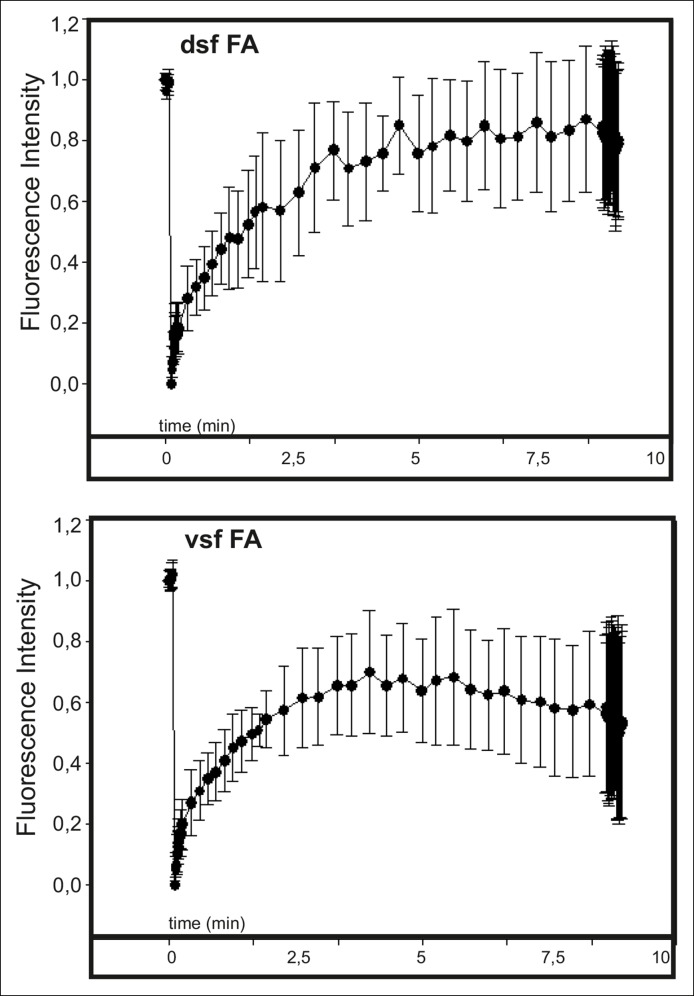
Figure 2—figure supplement 2. Actin dynamics in focal adhesions located at the tips of dorsal and ventral stress fibers.
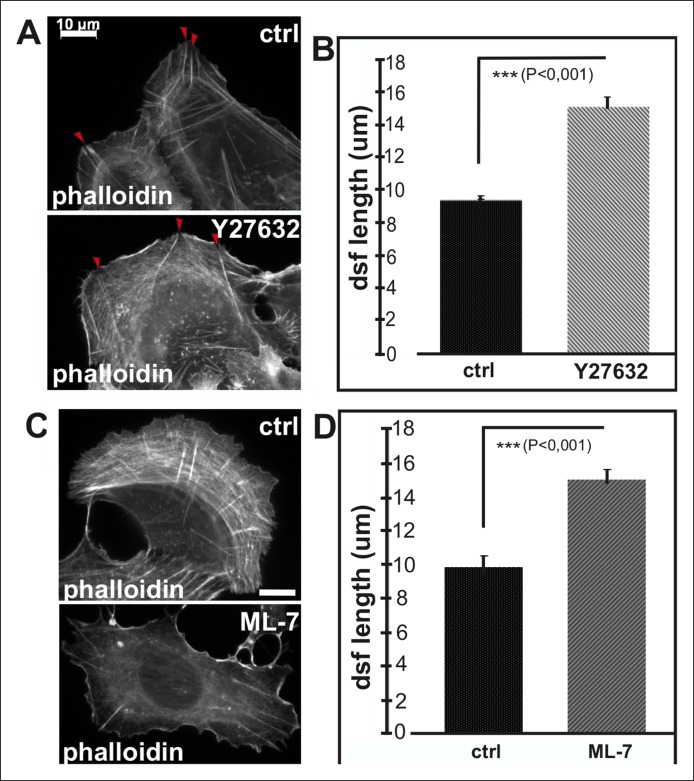
Figure 2—figure supplement 3. Inhibition of myosin light chain phosphorylation results in formation of abnormally long dorsal stress fibers.
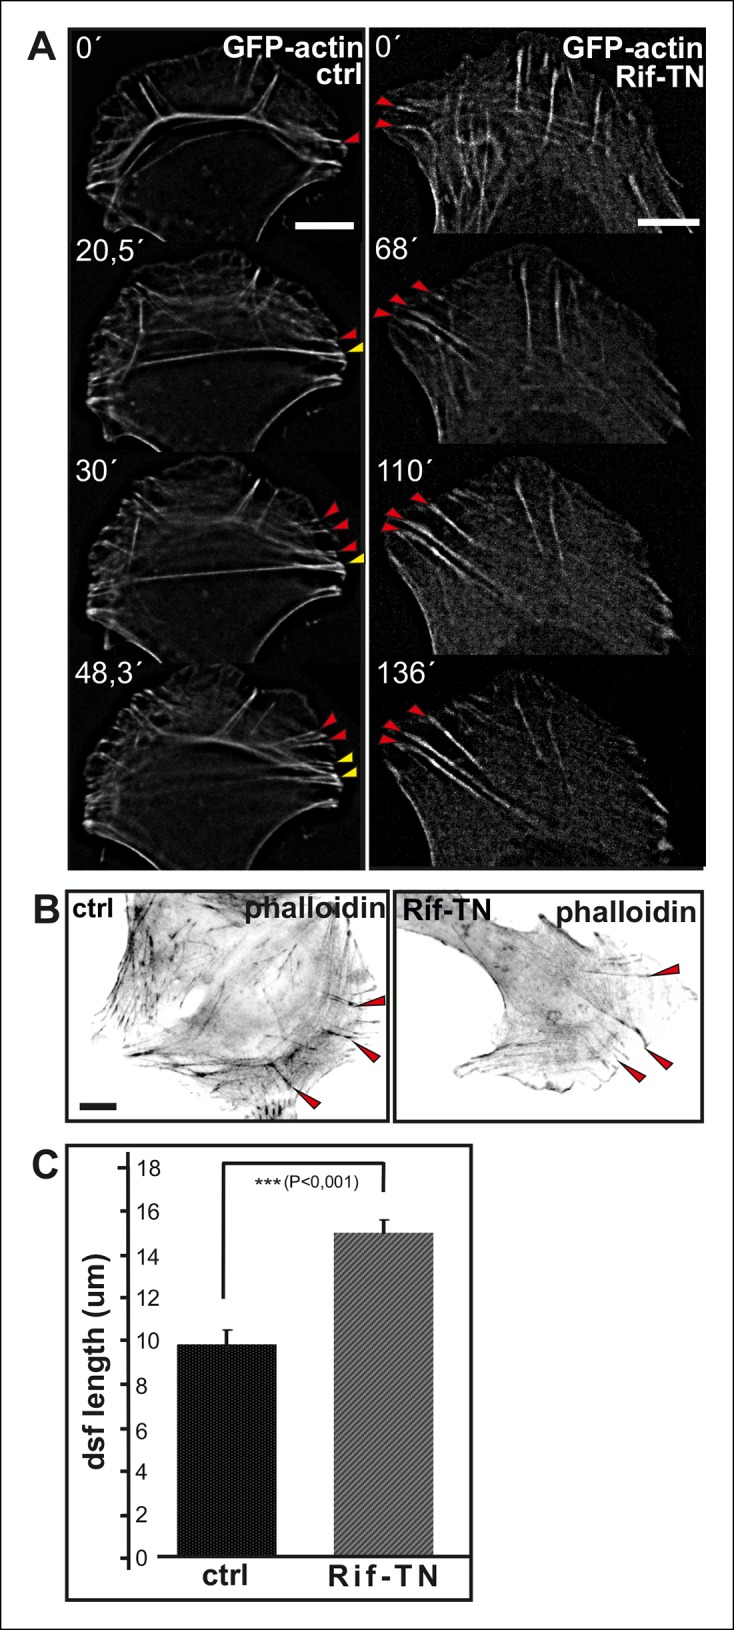
Figure 2—figure supplement 4. Expression of dominant inactive Rif leads to abnormal elongation of dorsal stress fibers.


