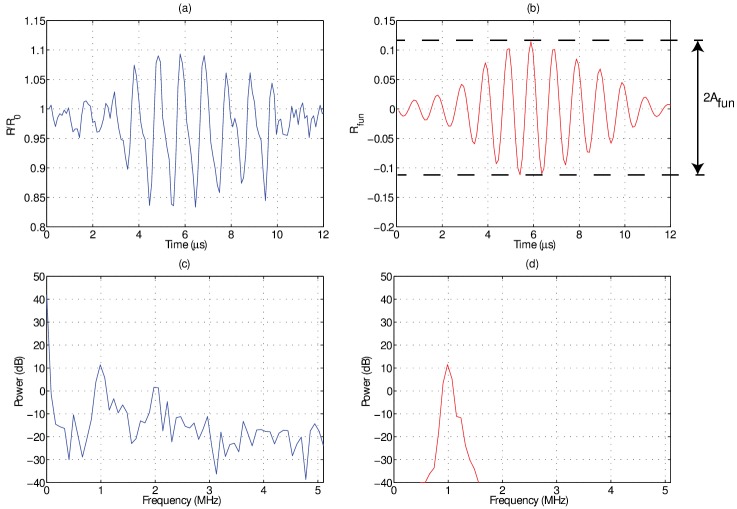
FIG. 2.
(Color online) An example of the data analysis performed on individual microbubble radius-time curves in order to obtain the relative fundamental oscillation amplitude (). (a) The raw normalized radius versus time curve and (c) its Fourier transform as extracted from an ultrafast frame rate microscopy recording of a 3.7 μm diameter microbubble in a 1 cP solution. After applying a band-pass filter around the transmit frequency (1 MHz), panels (b) and (d) illustrate the resulting time and frequency domain representation; namely the radial oscillations at the fundamental frequency . The amplitude of this function is defined as the relative fundamental oscillation amplitude .

