
Figure 5.
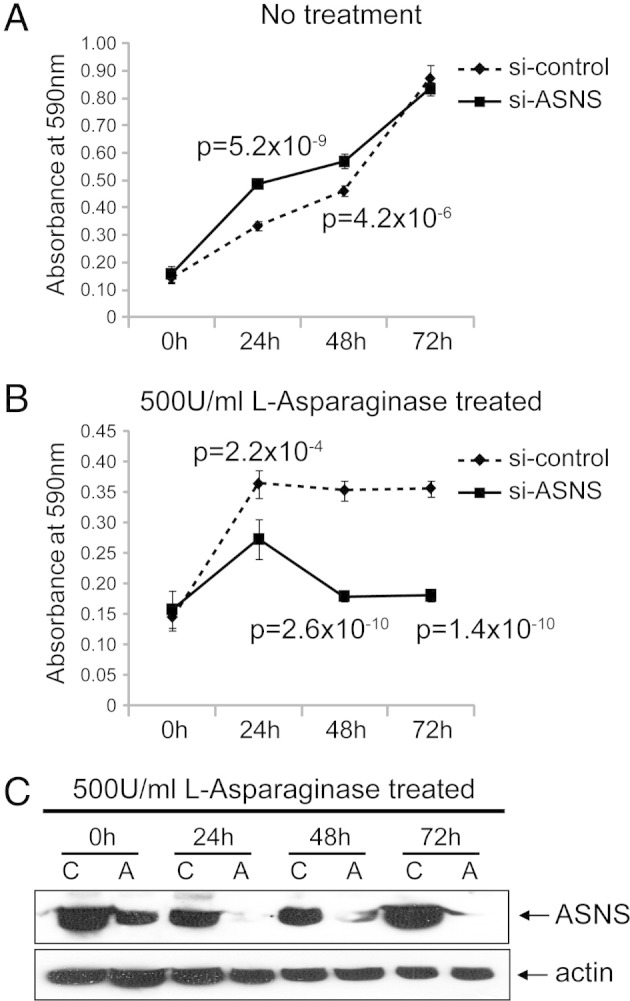
Cell viability of LNCaP cells after siRNA knockdown of ASNS. MTT cell growth assays. The experiments and MTT assays were performed in a similar manner to that described in Figure 4, except LNCaP cells were used. The plots for the no treatment (A) and 500 U/mL of l-asparaginase-treated (B) groups represent data from a mean absorbance of 590 nm from six wells for each time point. si-control, control siRNA. C: Western blot analysis to evaluate the performance of si-ASNS in LNCaP cells was performed in a similar manner to that described in the legend to Figure 4C. A, si-ASNS; C, control siRNA.