
Figure 3.
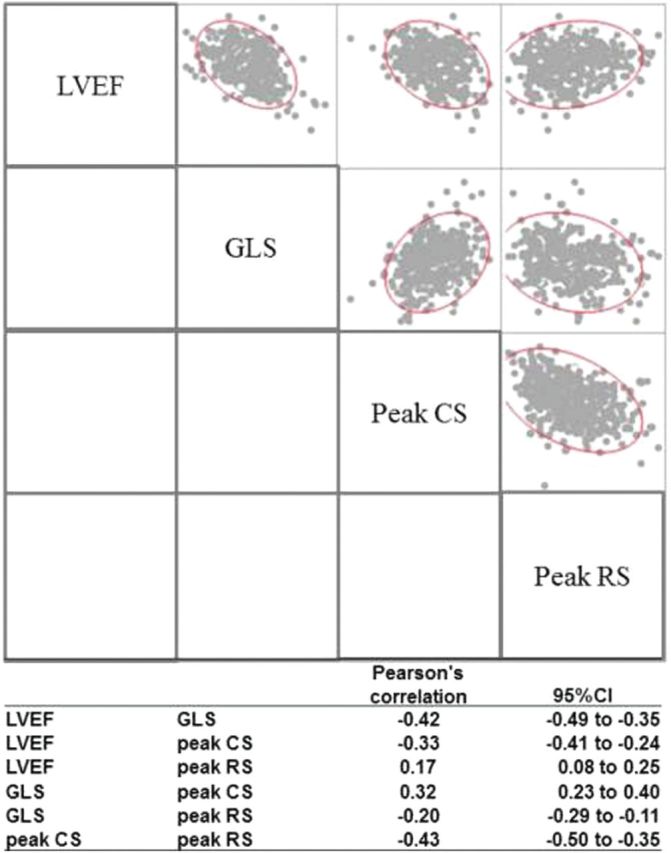
A scatterplot matrix of correlation between measures of LV strain and with LVEF, with Pearson’s correlation r, and 95% confidence interval. Abbreviations: CS, LV peak circumferential strain; GLS, LV global longitudinal strain; RS, LV peak radial strain.