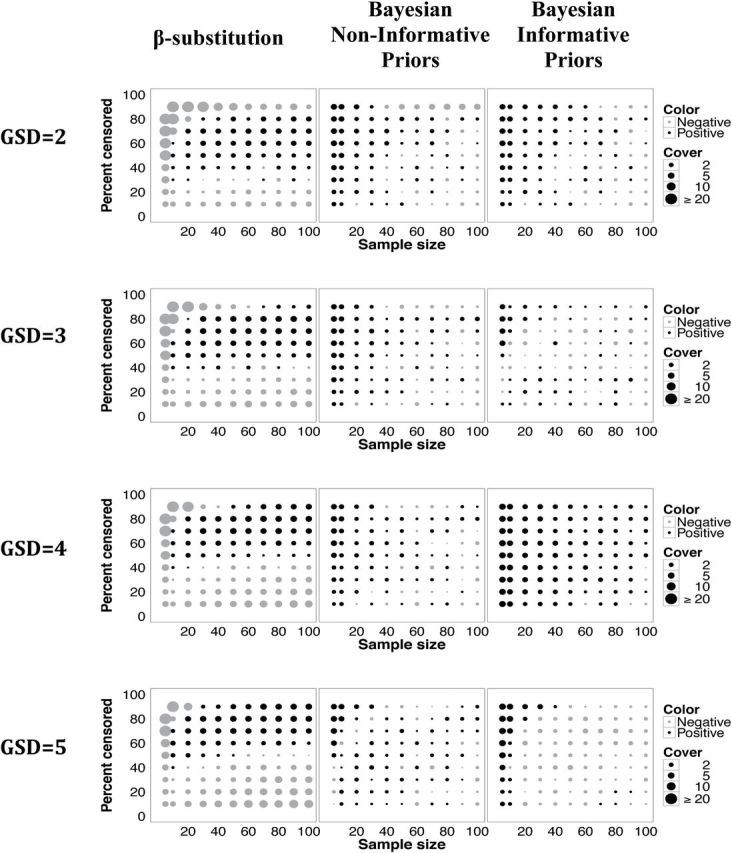
Figure 4.

Coverage probabilities (in percent) for the AM of a lognormal distribution and a single LOD for the β-substitution method and the Bayesian method with non-informative and informative priors. The size of the circle represents difference between the actual coverage probability minus the target 95%. Positive dots indicate probabilities larger than 95%. The difference can only be up to 5% in the positive direction (indicating 100% coverage), whereas negative dots indicate probabilities less than 95%. While 100% coverage is not as desirable because the uncertainty estimates maybe too wide to be informative, large negative coverage (approximately <90%) might be worse because it indicates that the interval frequently missed the true value.
