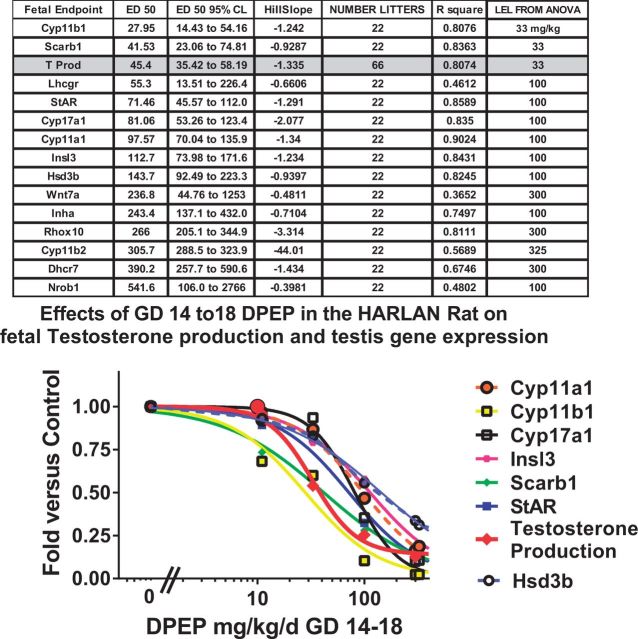
FIG. 3.
Logistic regression analyses of fetal testosterone production (T PROD) and the mRNA for 13 genes with reduced expression levels as a consequence of in utero DPeP exposure. Values in the headings are all derived from the 4PL regression model (constrained to 0 and 1.0) except the LEL from the ANOVA (followed by LSMEANS) which is the lowest dose of DPeP that significantly (P < .05) reduced the gene expression level versus the control.

