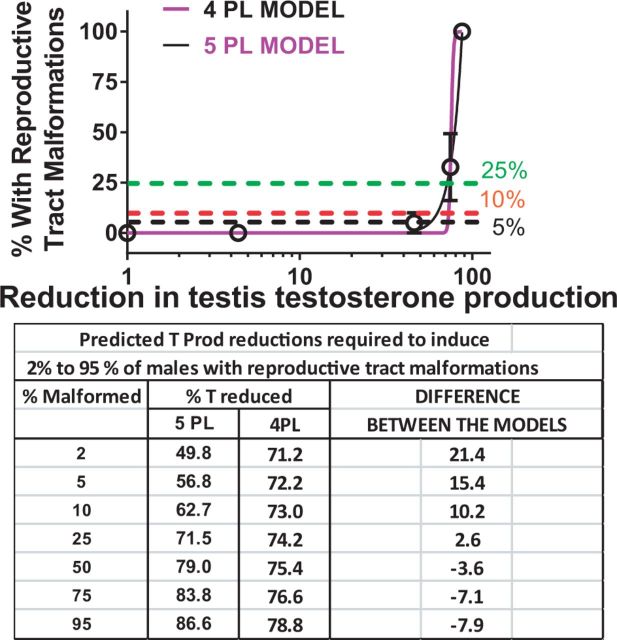
FIG. 6.
The percent of F1 males with reproductive tract malformations per dose group and percent reduction in fetal testis testosterone production was fit to 2 logistic regression models; the 4PL parameter model which assumes symmetry on both sides of the ED50 and a 5PL parameter model which includes an additional parameter to estimate asymmetry. This was done in order to try to provide a better fit in the region of the curve with low malformations rates. As seen in the accompanying table, the predictions of the amount of reduction in testosterone production differs considerably at low malformations rates. Further research is required to enable us to determine which model is the “best” model of the T PROD versus malformation data. BRR T PROD values interpolated from the 4PL and 5PL parameter logistic regression curves. The dashed lines represent where the 25%, 10%, and 5% malformation rates intersect the curve and suggest that the predictions of the % reduction in T PROD required to induce malformations differ by as much as 21%. The parameters of the 4PL model include the top, bottom, ED50, and slope of the curve whereas the 5PL model also estimates the degree of asymmetry of the curve.

