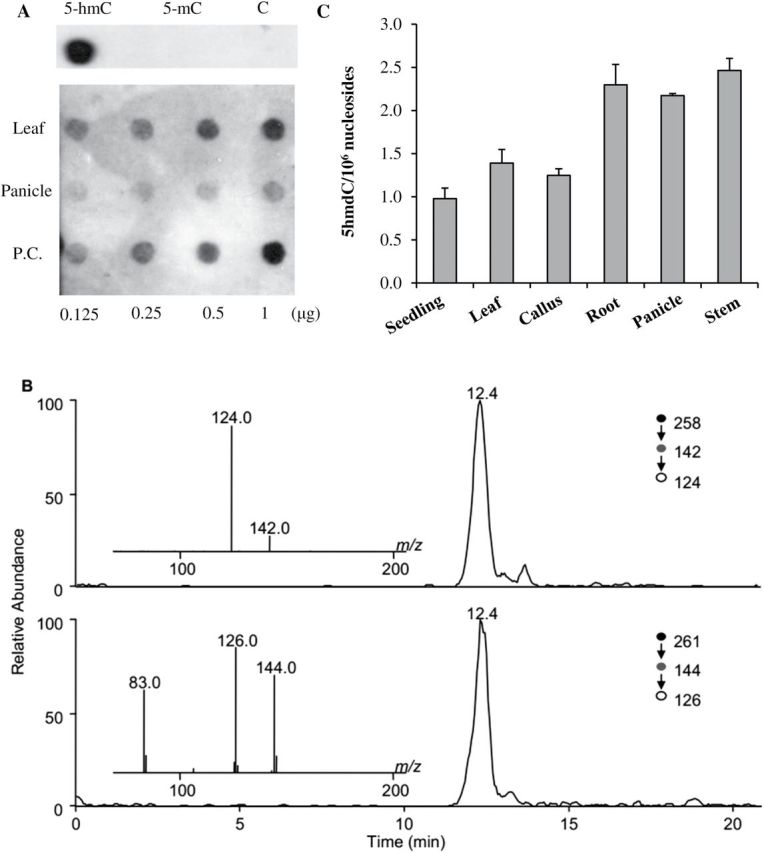
Fig. 1.

Detection and quantification of 5hmC from genomic DNA isolated from rice tissue. (A) Dot-blot detection of 5hmC in leaf and panicle DNAs from indica rice (93-11) with α-5hmC-specific antibodies. The upper panel indicates the specificity of the antibody for 5hmC. P.C., positive control; (B) Representative LC-MS/MS/MS results for the quantification of 5hmdC in rice leaf DNA. Shown in the panels are selected-ion chromatograms for monitoring the indicated transitions of 5hmdC (top panel) and [1,3-15N2, 2′-D]5hmdC (bottom panel), and in the insets are the MS/MS/MS results for the analyte and internal standard; (C) Quantification of 5hmdC in genomic DNA isolated from different rice tissues with the same LC-MS/MS/MS method. The y-axis shows the number of 5hmdC modifications per million nucleosides. The data represent the means and standard deviations of three independent LC-MS/MS/MS measurement results.
