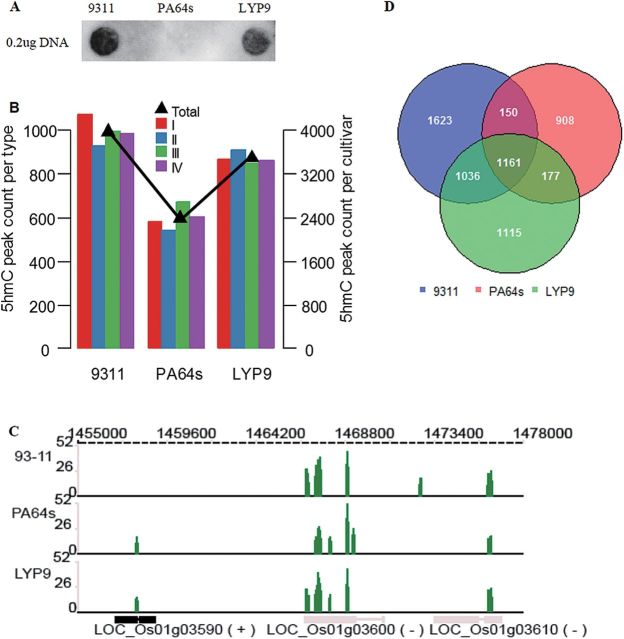
Fig. 2.
Specific and conservative distributions of 5hmC modification among cultivars. (A) Dot-blot results of genomic DNA samples from panicles 3–4mm in length from three rice cultivars with α-5hmC-specific antibodies; equal amounts of loaded DNAs were used for detection. (B) Number of identified 5hmC peaks in each cultivar (the right y-axis) and their number distribution in each class (the left y-axis). (C) An example showing marked intercultivar similarity of 5hmC modification in read levels among the three cultivars. (D) Overlap of identified 5hmC peaks among the three cultivars.

