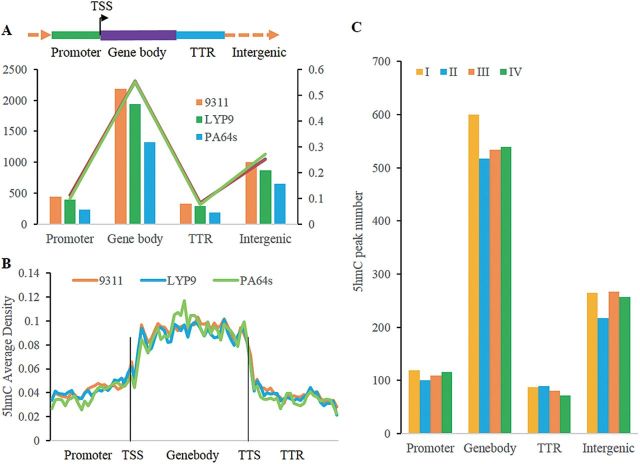
Fig. 3.
Genome-wide profiles of 5hmC modification among cultivars. (A) Distribution of 5hmC peaks in the whole genome. The left y-axis indicates the number of 5hmC peaks, and the right y-axis indicates th ecorresponding ratio in total peak number. (B) Average 5hmC enrichment over genes. The promoter, gene body, and TTR were divided into 25, 35, and 25 equally sized bins, respectively, from 5′ to 3′ to calculate the 5hmC average density in each bin. (C) 5Hmc peaks number distribution of 5hmC peaks in each class of 93-11 in the whole genome.

