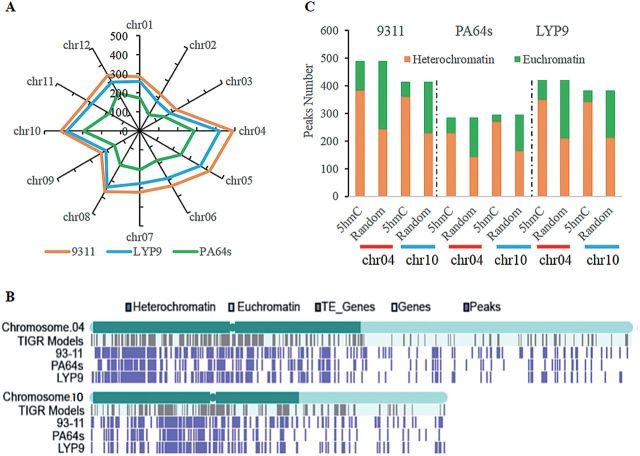
Fig. 4.
Distribution of 5hmC peaks. (A) The number of 5hmC peaks in each chromosome in three cultivars. (B) Distributions of 5hmC peaks and annotated gene models in heterochromatin and euchromatin of chromosomes 4 and 10. (C) Distributions of 5hmC peaks in heterochromatin and euchromatin of chromosomes 4 and 10 compared with a random data set for 93-11, LYP9, and PA64s, respectively.

