Fig. 5.

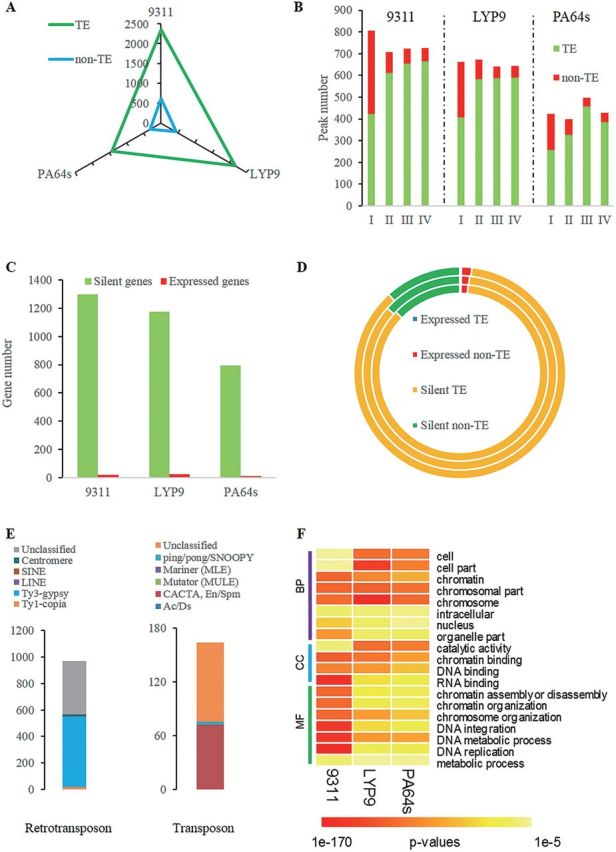
Predominance of 5hmC peaks to TE genes compared with non-TE genes. (A) The numbers of 5hmC peaks in TE genes and non-TE genes among the three cultivars. (B) The numbers of 5hmC peaks of each class in TE genes and non-TE genes. (C) The numbers of expressed and silent genes with more reliable peaks (MRPs). (D) The numbers of expressed and silent genes with MRPs (including TE and non-TE genes). The inner circle indicates genes with MRPs in 93-11, the outer LYP9, and the middle PA64s. (E) The numbers of retrotransposons and transposons with MRPs for 93-11. (F) Enriched GO annotation results (partial) of genes with MRPs using agriGO. BP, CC, and MF indicate the three categories: Biological Process, Cellular Component, and Molecular Function, respectively.
