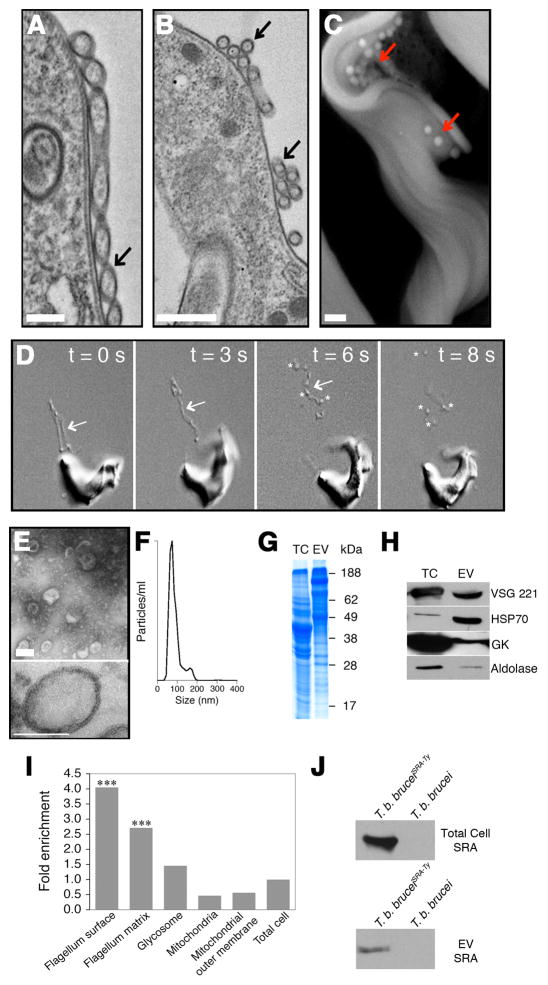
Figure 2. Nanotubes vesicularize into EVs.
(A) TEM of a nanotube (black arrow) (bar = 400 nm) and (B) spherical units (black arrow) (bar = 500 nm). (C) Free EVs (red arrows) at the trypanosome surface visualized by SEM (bar = 400 nm). (D) Successive DIC video frames of nanotubes (arrows) dissociating into free EVs (asterisks) (see Movie S5). (E, upper panel) Negative stain TEM of purified EVs (bar = 100 nm). (E, lower panel) TEM thin section of purified EVs (bar = 100 nm). (F) Nanoparticle tracking analysis of EVs. (G) EV proteins visualized by SDS-PAGE (total cell, TC). (H) Western blotting of EVs with anti-VSG, HSP70, glycerol kinase and aldolase. (I) Analysis of the EV proteome for relative enrichment with flagellar surface, flagellar matrix, glycosome, mitochondria and mitochondrial outer membrane proteins in relation to the total cell proteome (***, p < 0.001). (J) Western blot of total cell and EVs from T. b. bruceiSRA-Ty. See also Figures S1E–F, Movie S5, Table S1 and S2.

