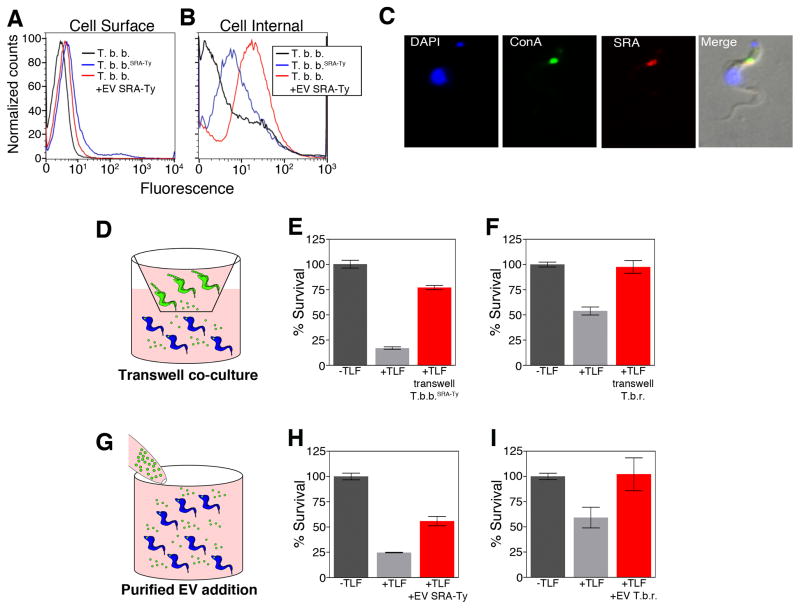
Figure 3. EVs transfer TLF resistance.
(A) Flow cytometry of fixed T. brucei (black), T. b. bruceiSRA-Ty (blue) and T. brucei treated with SRA containing EVs (red). (B) Flow cytometry of fixed and permeabilized T. brucei (black), T. b. bruceiSRA-Ty (blue) and T. brucei treated with SRA containing EVs (red). (C) Fluorescence microscopy of T. brucei treated with EVs containing SRA. ConA showed internalization and co-localization in the endocytic pathway. (D) Diagram of transwell co-culture of T. brucei with T. b. bruceiSRA-Ty or T. b. rhodesiense. (E & F) TLF overnight survival assays. T. b. brucei not treated with TLF (negative control) (dark grey) T. b. brucei treated with TLF (positive control) (light grey). (E) Co-culture of T. b. brucei with T. b. bruceiSRA-Ty (red) and (F) co-culture of T. b. brucei with T. b. rhodesiense (red). (G) Diagram depicting addition of EVs from T. b. bruceiSRA-Ty or T. b. rhodesiense to T. b. brucei. (H & I) TLF overnight survival assays. T. b. brucei not treated with TLF (negative control) (dark grey) T. b. brucei treated with TLF (positive control) (light grey). (H) Addition of EVs purified from T. b. bruceiSRA-Ty (red) and (I) addition of EVs purified from T. b. rhodesiense (red). Bars represent the mean ± SEM for three experiments. See also Figures S2A–E, S4 and S5.

