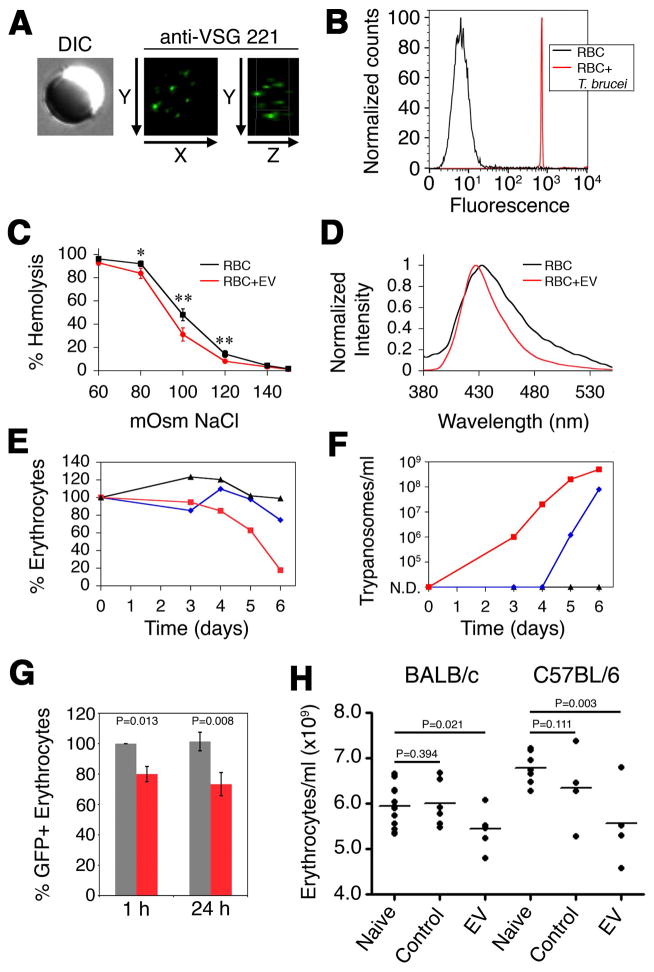
Figure 6. EVs alter erythrocyte physicochemical properties and stimulate clearance.
(A) Erythrocytes were incubated with EVs, probed with anti-VSG 221 and visualized by fluorescence microscopy. (B) Erythrocytes were incubated in transwells in the presence (red) or absence (black) of T. brucei, probed with anti-VSG 221 and analyzed by flow cytometry. (C) Erythrocyte lysis was measured by quantifying hemoglobin concentration in supernatant (black, untreated erythrocytes; red, erythrocytes + EVs) (*, p < 0.05; **, p ≤ 0.005). Scale bars represent the mean ± SEM for four experiments. (D) Laurdan emission spectra of erythrocytes alone (black) or treated with EVs (red). (E) Anemia in T. brucei-infected mice was followed by hemocytometer counts, normalized to pre-infection, in a heavily infected mouse (red), moderately infected mouse (blue) and a mouse with undetectable parasitemia (black). (F) Parasitemia of the mice shown in panel E. (G) Mouse erythrocytes containing GFP were incubated with (red) or without (grey) purified EVs and injected into the tail vein of naive mice. GFP-erythrocytes were quantified by flow cytometry. Scale bars represent the mean ± SEM for four experiments. (H) Purified EVs were intravenously injected into naive mice and erythrocytes were quantified 1 h post injection. P-values were calculated by one-tailed student T-test. See also Figures S5.

