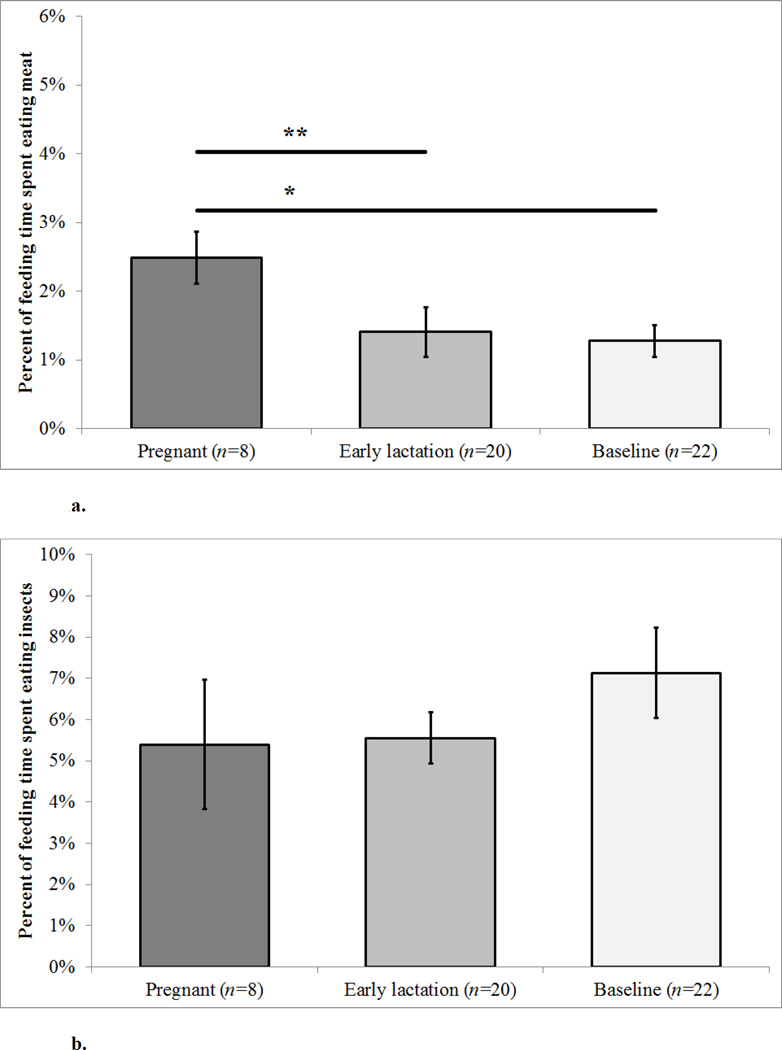
Figure 1. a–b. Mean Faunivory by Reproductive State.
Error bars represent the standard error (S.E.) The n value gives the number of females in each reproductive state. Individual females may appear in more than one reproductive state category. ** indicates a pairwise difference (p<0.05) and * indicates a tendency (p<0.10) as determined by Tukey’s test.

