Fig. 1.

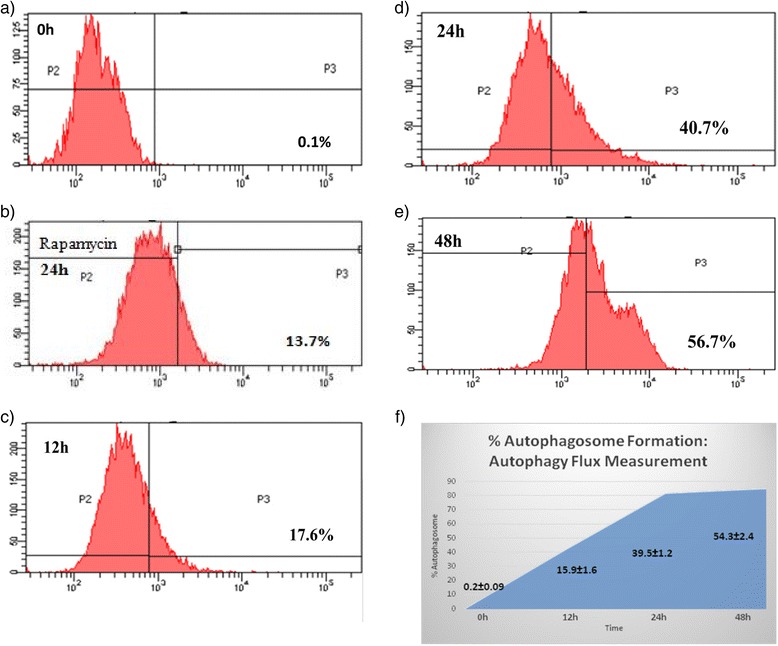
Autophagy Flux Measurement. HT-29 cells were treated with 2c for different time intervals (12, 24, 48 h) and one set with Rapamycin (positive control) for 24 h only. Autophagy was measured by staining autophagosomes and autophagic compartments with the fluorescent probe Cyto-ID® Green. a Control cells (b) positive Control and 2c treated HT-29 cells of (c) 12 h, (d) 24 h, (e) 48 h were stained and analyzed in the green (FL1) channel of the FACS Caliber flow cytometer. f The graphical representation of autophagosome formation shown increasing percentage of autophagosomes with respect to control cells according to the different time periods. This indicates increase in autophagy flux formation in a time dependent manner. The figures are representative profile of at least three experiments
